How are ERPs generated?
Now let’s look at the underlying biology of how ERPs are generated. Most ERPs are generated as a result of postsynaptic potentials. Postsynaptic potentials are the voltages that occur when neurotransmitters bind to the receptors of postsynaptic cell.
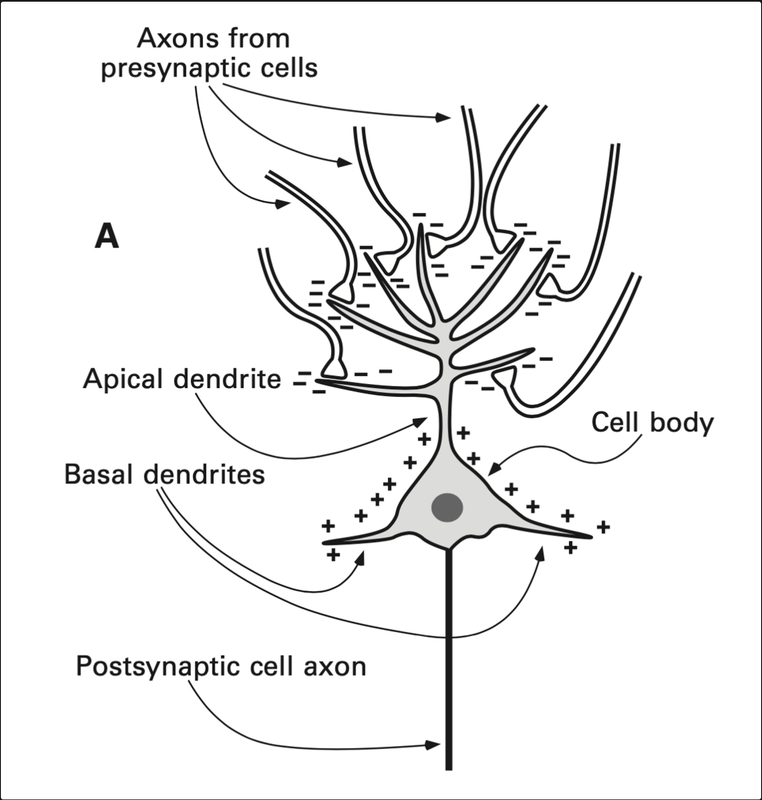
Mainly, ERPs are resulted due to pyramidal neurons, which are the most populous cells of the excitatory type of cells brain. The following is a diagram showing the structure of the same.

When an excitatory neurotransmitter is released, electrical current in the form of positively charged ions will flow from the extracellular space into the cell, making a negative charge in the region of the apical dendrites. To complete the circuit, current flows out of the basal dendrites, creating a dipole, which refers to (https://byjus.com/question-answer/what-is-an-electric-dipole/) a pair of electric charges of equal magnitude but opposite sign, separated by some (usually small) distance. (When the neurotransmitter is inhibitory, the flow of current is opposite, so the polarity of the recorded signal is the opposite. But as polarity usually doesn’t tell us much, it is not something you have to worry thinking about.) Put simply, it is the summation of multiple of these dipoles from around the brain, when certain conditions are met, that produces the measurable voltage in the EEG.
Large numbers of neurons must be activated at the same time. • The individual neurons must have approximately the same orientation. • The postsynaptic potentials for the majority of the neurons must arise from the same part of the neurons (either the apical dendrite or the cell body and basal dendrites). • The majority of the neurons must have the same direction of current flow to avoid cancellation.
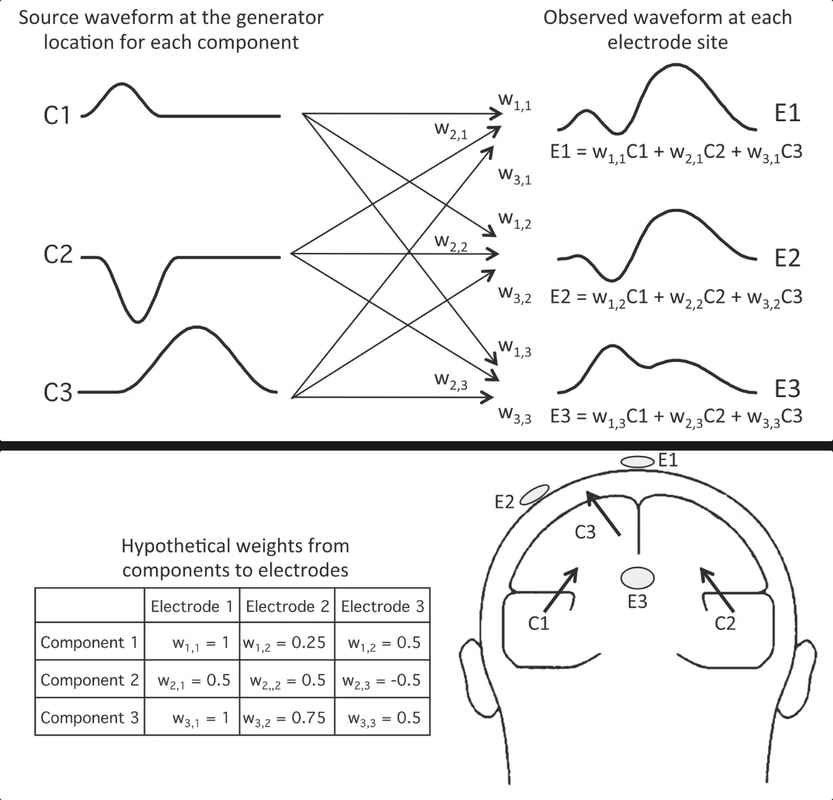
When you look at an ERP waveform, it is actually the weighted sum of multiple components in the brain. By weighted, we mean that each component waveform has a weighting factor, that is determined based on the location from where it is coming, the orientation of the dipole and the conductivity of tissues that form the head. The following diagram illustrates this:

Here, C1, C2, C3 represent the represent the waveforms at different locations in the brain. Each of them is then multiplied by the corresponding weights, and then all are summed up to give us the waveform that is picked up by the electrodes at their respective site.
While this example shows three components, in general the voltage at a given electrode site is the result of almost all the underlying components in the brain. Electrodes can pick up dozens of components in the brain during recording. There is no foolproof way of identifying which exact components result in the observed waveform. This is called the superposition problem.
All in all, when looking at your waveforms in the OpenBCI GUI, know that they are the result of the weighted sum of multiple other electrical signals in and around the electrode site, and not the singular exact signal of that site.