Home
Created with love by Neurotech@Davis Board Members
Welcome to the Neurotech@Davis Wiki, your comprehensive resource for all things related to neurotechnology. Here you will find learning resources, documentation and guides.
What is Neurotech?
Neurotechnology, or Neurotech for short, is a dynamic and multidisciplinary field that harnesses the power of technology to study and interact with the brain and the nervous system. It encompasses a wide range of exciting areas, including:
- Neuroimaging: Explore the world of brain imaging techniques, such as fMRI, EEG, and PET scans, that allow us to peer into the intricacies of the brain.
- Brain-Computer Interfaces (BCIs): Learn about cutting-edge technologies that enable direct communication between the brain and external devices, opening up new possibilities for communication and control. Signal Processing: Dive into the world of signal processing, where we analyze and make sense of neural data to uncover hidden patterns and insights.
- Machine Learning: Discover how machine learning and artificial intelligence are revolutionizing our understanding of the brain and its functions.
- Deep Learning: Explore the role of deep learning in decoding brain signals and advancing neuroscientific research. Neuroethical Considerations: Delve into the ethical dimensions of neurotech, including issues related to privacy, consent, and responsible data use.
How to use this Wiki?
This wiki is designed to be a collaborative space where we can collect our resources and insights and share them with you. Here's how you can make the most of it:
- Browse: Use the index on the left to navigate through the various pages. You will find sections within those pages making topics easier to find.
- Contribute: Feel free to reach out to any Neurotech officer to contribute to this wiki, we are more than happy to let you contribute. There is always something to add in the Wiki as it is always a work in progress
- Learn: Whether you're a beginner or an expert, you'll find articles that cater to your level of knowledge.
To clone this Wiki locally, enter the following command:
git clone https://github.com/Neurotech-Davis/Neurotech-Wiki.wiki.git
Development Environment
By Priyal Patel for Neurotech@Davis
Your "dev" environment consists of certain software applications that run on your local device (ex. computer). Using these applications, you can easily share code, organize your files, and write/test code. In this section, we will be covering how to use the OpenBCI GUI, Github, git, VSCode, Jupyter Notebooks, and the terminal.
What is OpenBCI?
By Priyal Patel for Neurotech@Davis
OpenBCI is a neurotech company whose hardware we use to collect brain data. Using their GUI, we are able to visualize the data in real-time and access these recordings in "./Documents/OpenBCI_GUI".
Installing GUI
Follow this guide to install the OpenBCI GUI.
Once the package appears in your “Downloads” folder, double click to open and keep clicking next button to fully install the package.
How to Use
Opening the GUI
In Finder/File Explorer, look for "OpenBCI_GUI" in Applications and then double click on the app.
If the error message below pop-ups, then right click on the app and click "open".
Starting a Secession
First, you need to have the USB dongle plugged into the device running the GUI and the cyton board turned on with batteries. See 'Data Collection Steps & Help' in Additional Resources for more information.
Then, select these options:
- CYTON (live)
- Serial (from Dongle)
- 8 CHANNELS
- OpenBCI
- File
Under "Secession Data" you can add a custom secession name.
Finally, click either "START SECESSION" or "AUTO-CONNECT".
Troubleshooting Errors
There are many reasons for why a red error message will appear when trying to start a secession.
Here are some ways to fix these errors:
-Try clicking either "START SECESSION" or "AUTO-CONNECT" at least 5 times. It usually takes a couple seconds before the connection is established.
-Check that the batteries have been plugged into the cyton board and are facing the correct direction in the holder.
-Check there is a light on the cyton board and the switch is set to "PC".
-Check that there is a red light flashing on USB dongle. If not, then switch the black reset switch to the right and then back to the left.
-Relaunch the GUI and repeat the secession starting process.
-Replace any dead batteries.
-Use another device as the GUI runs better on some devices compared to others.
Starting/Stopping a Stream
Press "Start Data Stream" button to begin recording brain data. After, press "Stop Data Stream" button to stop recording data.
See 'GUI Widgets' in Additional Resources to learn more about other GUI features.
Access Data
In Finder/File Explore, under Documents open the "OpenBCI_GUI" folder. In "Recordings", find the secession folder by the custom name you provided or by the date/time the secession was started. Inside the secession folder find all recordings based on date/time the recording was started.
Additional Resources
What is the Terminal?
By Priyal Patel for Neurotech@Davis
The Terminal is an application primarily used to easily access and edit your files using special commands. It is referred to as the Command Prompt on Windows. The commands used will differ based on the type of computer you have such as a MAC or Windows laptop. Developers also use the Terminal to install packages and run their code. The code's output or errors with how the code was written will be printed in the Terminal.
Commands
Commands are what you type after the cursor mark. Commands are structured as "[abbreviated action] [inputs]". When reading an instruction set, you can recognize Terminal commands by '$', '>', or '%' appearing before the command. To run the command, you will need to copy everything that appears right after one of these symbols into the Terminal and then hit enter. Commands are space and spelling sensitive, so you need to make sure you write each command exactly as it appears.
Path
A path is a way to represent where a folder or file is located. Each folder or file is separated by a '/'. Your desired folder or file will be the rightmost item and the folder(s) that contains this item will be located to the left; for example, "/folder/folder/file".
Absolute Path
This path starts with the root directory usually the 'Users' folder. The root directory is the folder that holds all of your folders and files; for example, "/Users/priyal/Desktop/Neurotech".
Relative Path
This is the shorthand version of the absolute path. To represent the previous folder, you can use '.'; for example, if you are currently in 'priyal' folder, then your shorthand path is "./Desktop/Neurotech".
Common Linux Commands
If you have a Windows laptop, then you will need to either install WSL before being able to run these commands or use the equivalent Windows commands. See 'WSL Installation Guide' or 'Windows Commands' in Additional Resources.
Manual Page: man
See what a command does and how to use it.
$ man <command>
Present Working Directory: pwd
See what folder you are currently in (absolute path).
$ pwd
List: ls
See the contents of the folder you are currently in.
$ ls
Concatenate: cat
See the contents of one or more files in the order specified.
$ cat <file1-name> <file2-name>
Move: mv
Move a file to a new location or rename file/keep file in same location.
$ mv <file-you-want-to-move> <new-path-or-name>
Change Directory: cd
Go from your current folder to another folder.
$ cd <absolute-or-relative-path>
The shorthand to go back to the parent folder is:
$ cd ..
Make Directory: mkdir
Create a folder with the specified name.
$ mkdir <folder-name>
Remove Empty Directory: rm -r Delete a folder and all of its contents.
$ rm -r <folder-name>
Remove Non-Empty Directory: rm -d Delete an empty folder.
$ rm -d <folder-name>
Remove File: rm Delete a file.
$ rm <file-name>
Clear: clear
Remove all commands from the Terminal's display. If you use the up arrow key, then you can still see some of the past commands used.
$ clear
Stop Execution: ^c (ctrl+c)
After running a command, you can use this shortcut to prevent the command from finishing execution.
$ <command>
^c
For a full list of commands, see 'Unix Tutorial' or 'Linux Commands Cheat Sheet' in Additional Resources.
Additional Resources
What is Jupyter Notebook?
By Priyal Patel for Neurotech@Davis
Jupyter Notebook is a web application that allows you to easily write, run, and visualize smaller chunks of code. It is commonly used for data preprocessing and analysis.
Installing Jupyter Notebook
First, install python by downloading newest release and choose the version where the operating system matches the device you are using (ex. macOS for a MAC).
After, install pip using either method mentioned (ensurepip or get-pip.py).
Finally, open the Terminal (Mac/Linux) or Command Prompt (Windows) and run this command:
$ pip install notebook
See 'Anaconda Navigator' in Additional Resources for an alternative installation method.
How to Use
Opening Jupyter Notebook
To open Jupyter Notebook, run this command:
$ jupyter notebook
Make sure the Terminal window that you used to run this command stays open the whole time you are using Jupyter Notebook.
Files and Folders Structure
The Files section will look very similar to Finder (Mac) or File Explorer (Windows). If you select the box next to a folder/file, then click on an option this change will also automatically apply to your Finder/File Explorer. For example, if you delete a file, then you will need to go to your trash to recover it.
Creating a Notebook
Navigate to the folder where you want the notebook to be stored. Click "New" and select "Python 3". The new notebook will open in a new tab. If you navigate back to the folder, then a .ipynb file will have been added.
Press Save
The most important thing to remember is to periodically press the "save" button especially before closing the notebook or your laptop. After pressing the button, make sure a checkpoint created message appears.
Cells
Each box is called a cell. Using cells allows you to split up your code into multiple cells and add markdown cells to provide written explanations. Cells can be run in any order; however, if certain code requires an imported package, then the cell importing the package needs to be run first.
To add a cell, either click on "+" or select an option under "Insert". Use the dropdown to specify what type of cell (ex. code).
More operations with cells can be found under "Edit".
To run a cell, either click on "> Run" or select an option under "Cell".
See the 'Beginner Tutorial' in Additional Resources for more features and how to use them.
Closing Jupyter Notebook
Close all tabs in your browser that are running Jupyter Notebooks. Then, type (ctrl+c) and after 'y' in the Terminal used to open Jupyter Notebook:
^c
y
Additional Resources
What is VSCode?
By Priyal Patel for Neurotech@Davis
VSCode is an IDE, integrated development environment. What this means is it combines various applications that run separately into one application.
VSCode is just one option, so feel free to use your preferred IDE.
Installing VSCode
Download the application on to your device.
How to Use
In Finder/File Explorer, under Applicantion find "Visual Studio Code" and click to open.
Review the 'Getting Started Guide' in Additional Resources.
Key Features
File Tree
Allows you to see, edit, and easily move all sub-folders and files in your project.
Terminal
The terminal is easily accessible from within VSCode. This allows you to run your code faster and easily check-in your code using git; the next section will provide more information about git.
Extensions
Also known as plugins, Extensions allows you to install packages. These could be necessary dependencies for your code or tools to help make the process of writing code easier. Feel free to explore the plugins available.
Here are some useful plugins:
WSL
For Windows users, this plugin will allow you to use linux commands in the terminal.
Live Share
This plugin allows multiple people to edit the same files in real time.
See the 'Live Share Guide' in Additional Resources for more information.
Prettier
When you click save, this plugin automatically formats your code to match standard coding formatting practices. This allows for consistent formatting and helps with make your code more readable.
Additional Resources
What is Github?
By Priyal Patel for Neurotech@Davis
Github is a web application that stores multiple versions of a project. This allows multiple users to make changes to the project at the same time. The application also has features that allow users to easily integrate all of their changes into one project.
Repository
A repository stores all files and folders needed for a project. You can also see the project's revision history.
Branches
One way to maintain multiple versions of the project is by using separate branches. The branch that holds the desired version of the project is called Main; this will be automatically created when you create a repository.
Users are able to make a new branch that contains a copy of the content in the Main or any other branch. This also called forking a respository.
Pull Request
Users can integrate their changes in their branch into another branch by opening a pull request.
Clone Repository
To make changes, a user will need to clone the desired repository. This will create a copy of the repository on your device. You will need to use git (mentioned below) to download changes from other users and upload your changes.
README
Users will add any important information about your project using markdown to the README.md file.
How to Use
Creating an Account
Follow Part 1 of this guide to setup your github account.
See the 'Github Hello World' guide in Additional Resources to practice using the features mentioned above.
What is Git?
Git is the version control software that interacts with Github (repository storing service). Git is a tool that allows users to interact with different versions of the project. Using Git, users can save the changes on their device, upload their changes to the Github repository, switch to another version of the project, and perform many more tasks.
Remote Repository
The repository that appears on Github. This respository is stored on Github servers.
Local Repository
The repository that stored on your device. It consists of everything in the .git directory.
Staging Area
The staging area consists of the files you want git to track. You must explicitly add these files to the staging area each time you want git to know about new file edits.
Working Directory
This is the folder on your device that holds all files and folders in your local repository.
All of your changes are only stored here until you add them to the staging area, commit them to the local repository, or push them to the remote repository.
See 'Medium on Git' in Additional Resources for more information.
Installing Git
Download the git version that matches your device.
How to Use
This tutorial will be using VSCode and show you how using VSCode will make the process of using git easier. The tutorial will be only using the MAIN branch, so see 'Git Branches' in Additional Resources for using multiple branches.
Setting Credentials
Follow this guide to set up git and link your account.
Create a Respository
On Github:
- Sign into your account
- Click on your profile
- Click on 'Your repositories'
- Click on the green button 'New'
- Give your repo a name
- Select public or private
- (Optional) Select 'Add a README file'
- Click 'create repository'
Cloning a Repository
You can either clone an existing repository or create a new one and then clone this repo. For private repositories, you can only clone them if you are added as a contributer. See 'Adding Contributors' in Additional Resources.
Go to your repository and click on the green 'Code' button. Copy the link under 'HTTPS'.
In VSCode terminal run:
$ git clone <https-repo-url>
Git Changes Workflow
After making changes to a file, the first step is to make sure you get any new changes another user has made on the same branch. If you do not do this, then you will overwrite the changes that other users have made. :(
$ git pull
If you have merge conflicts, then see 'Resolving Merge Conflicts' in Additional Resources.
Next, you will need to add the changes to the staging area. Make sure you are in the parent folder that has all your changes (hint: use cd terminal command to navigate to the correct folder).
$ git add .
(Optional) To see what files have been added to the staging area, you can run this command:
$ git status
Then, you will need to save a copy of all these changes to your local repository (.git).
$ git commit -m "<any-description-of-changes>"
Finally, you can move the changes from your local repository to the remote repository on Github.
$ git push
The first time you run this process you will need to run this command instead (default branch name is MAIN):
$ git push --set-upstream origin <branch-name>
See 'Git Workflow' in Additional Resources for more information about these steps.
Additional Resources
- Github Hello World
- Medium on Git
- Git Branches
- Git Cheat Sheet
- Git Workflow
- Adding Contributors
- Resolving Merge Conflicts
Fun Fact
This WIKI is hosted in a remote repository called 'Neurotech-Wiki' and all my changes were added using git.
Python Basics
By Dhruv Sangamwar for Neurotech@Davis
Python is a versatile and popular programming language known for its simplicity and readability. In this tutorial, we will cover the basics of Python, including variables, data types, control structures, functions, and more.
Table of Contents
- Table of Contents
- 1. Getting Started
- 2.Variables and Data Types
- 3. Control Structures
- 4. Functions
- 5.Modules and Packages
- 6. File Handling
- 7. Error Handling
- 8. Object Oriented Programming
- 9. Conclusion
1. Getting Started
1.1. Installing Python
Before you can start programming in Python, you need to make sure you have a text-editor and the right environment.
MacOS
- We personally recommend using Homebrew, a package manager that handles package download and installations
- Follow the following commands to install , python and some libraries.
/bin/bash -c "$(curl -fsSL https://raw.githubusercontent.com/Homebrew/install/master/install.sh)": Installs Homebrew.
export PATH="/usr/local/opt/python/libexec/bin:$PATH": This sets up the Path variable so that your command line can find python. The following commands will install python along with some libraries:
brew install python
python --version
pip install numpy
pip install seaborn
pip install matplotlib
We strongly reccomend that you use Visual Studio code as it has plenty of free plugins that make development in python easier.
If you want to use any additional packages, visit PyPi. This is the python package index where you can find installation instructions and documentation for packages. (Make sure to check which version you want before installation)
Windows
- Environment setup has a couple more steps on Windows
- Open command prompt as an administrator
- Run
wsl --installto install WSL2.- Restart your computer after the step.
- At this point you should be able to run
wslin your command prompt which should start a linux vm.- If this is not the case please reach out to anyone on the projects division to debug platform related issues.
- You can now use the same commands as above for MacOS to install python and all the related dependencies
- Install Visual Studio code and run
code .in your command prompt;code .should open up VScode where you can write all your python code.- WSL should detect that you are trying to open VScode, it will install the virtualized version of it automatically and open the desktop VScode client.
1.2. Running Python
You can run Python code in two ways: using the Python interactive interpreter or by creating Python scripts.
To start the Python interactive interpreter, open your terminal or command prompt and type:
python
You can also run Python scripts by creating a .py file and executing it with the python command.
# hello.py
print("Hello, Python!")
To run the script:
python hello.py
2.Variables and Data Types
In Python, you don't need to declare the data type of a variable explicitly. Python infers it based on the value assigned.
# Integer
x = 10

# Float
y = 3.14

# String
name = "Alice"

# Boolean
is_python_fun = True

# List
fruits = ["apple", "banana", "cherry"]

# Tuple
coordinates = (3, 4)

# Dictionary
person = {"name": "Bob", "age": 30}
3. Control Structures
Python provides various control structures like if, for, and while for managing program flow.
3.1. Conditional Statements
if condition:
    # Code to execute if the condition is True
elif another_condition:
    # Code to execute if the second condition is True
else:
    # Code to execute if none of the conditions are True
3.2. Loops
3.2.1. for Loop
for item in iterable:
    # Code to execute for each item in the iterable
3.2.2. while Loop
while condition:
    # Code to execute as long as the condition is True
4. Functions
Functions allow you to encapsulate code into reusable blocks.
def greet(name):
    """A simple greeting function."""
    print(f"Hello, {name}!")

# Calling the function
greet("Alice")\
5.Modules and Packages
Python has a rich ecosystem of modules and packages to extend its functionality. We installed some earlier if you followed the getting started section.
# Importing a module
import math
import numpy as np

# Using a module function
print(math.sqrt(16))

# using numpy
arr = np.array([[1, 2],
                [3, 4]])
print("Matrix: \n", arr)
6. File Handling
Python provides functions for reading from and writing to files.
# Opening a file for reading
with open("file.txt", "r") as file:
    content = file.read()

# Opening a file for writing
with open("new_file.txt", "w") as file:
    file.write("Hello, World!")
7. Error Handling
Use try and except blocks to handle errors gracefully.
try:
    # Code that might raise an exception
except ExceptionType:
    # Code to handle the exception
else:
    # Code to execute if no exception is raised
finally:
    # Code that always runs, regardless of exceptions
8. Object Oriented Programming
Python supports object-oriented programming (OOP) principles like classes and inheritance.
class Animal:
    def __init__(self, name):
        self.name = name

    def speak(self):
        pass

class Dog(Animal):
    def speak(self):
        return f"{self.name} says Woof!"

# Creating objects
dog = Dog("Buddy")
print(dog.speak())
9. Conclusion
This Python tutorial covered the fundamental concepts of the Python programming language, including variables, data types, control structures, functions, modules, file handling, error handling, and object-oriented programming. Python is a versatile language with a vast ecosystem of libraries and frameworks, making it suitable for your Neurotech projects.
Inportant Python Libraries for Data Analysis
By Manik Sethi for Neurotech@Davis
Now that we've covered the basics of Python, we will dive into libraries which give us additional functionality. In this tutorial, we will cover NumPy and Pandas . To follow this tutorial, make sure you have Python installed on your computer and a text-editor ready to work with.
Table of Contents
GOAT STATUS
1. Getting Started
1.1. Making Sure You Have PIP
Since libraries are add-ons to the basic version of Python, we need to install them onto our machines. We will be using the package installer for Python, which is called pip. First, we will ensure that the machine you're working on has pip. To do so, open up a terminal window and type the following command:
MacOS
python -m ensurepip --upgrade
Windows
py -m ensurepip --upgrade
Typically, pip comes with the installation of Python in your system. But we will run these commands as a preventative measure for any errors down the line.
Now, we will install the packages onto our system. Enter the following terminal commands. 1
pip install numpy
pip install pandas
1.2. Importing Libraries
Now that we have our libraries installed, we can call upon them in. our .py files. To use the functionalities of our library in a given .py file, we type this at the very top.
import numpy as np
import pandas as pd
Let's break down these lines phrase by phrase
importfollowed by the library name tells our code to load in the library, allowing us to access its functions and variables.- Using the
askeyword let's us shorten our library name and give it a nickname 2. That way, instead of having to call functions usingnumpy.function(), we can just donp.function()
2. NumPy
Now that we have imported NumPy, let's access and use it's functions and variables. For the sake of being concise we won't cover everything, but here is the documentation.
2.1. Array Fundamentals
Arrays will be incredibly useful for neurotech applications. All the brain data we will collect needs to be stored, and the np.array() datatype allows us to do so while also providing high functionality. Let's start by creating an array, which is just a list of objects.
Input:
import numpy as np
a = np.array([1, 2, 3, 4, 5, 6])
a
Output:
array([1, 2, 3, 4, 5, 6])
We used the np.array() function which takes in one argument: a list. However, this is just a one dimensional list, also known as a vector. In our use cases, it may be useful to have list of lists, also known as matrix. We can initialize one as shown below
matrix = np.array([[1, 2, 3], [4, 5, 6], [7, 8, 9]])
NumPy also comes with functions that return attributes of our array
matrix.ndimreturns number of dimensions of the array. Since we made a 2D matrix, it'd be2matrix.shapereturns the shape of our array, think of this as the length and width of our array, which is(3,3)matrix.sizetells you how many total elements exist in our array, which in our case is9
If we used basic Python lists, we'd have to define these shape, size, and other functions on our own which becomes redundant quickly. NumPy takes care of this and lets us work on the important parts of the project.
2.2. Indexing and Slicing
The data we collect will also need to be manipulated. Thankfully, NumPy takes care of this. Sometimes we only want to work with specific parts of our data because of it's temporal importance (when it happened) or spatial importance (where it happened)
import numpy as np
...
data = np.array([[1, 7, 3, 9],
				[2, 5, 0, 4],
				[7, 3, 4, 1],
				[8, 6, 0, 2]])
data[0]
data[2][1]
data[3]
data[5][0]
The integers inside the [] such as [0] represent the index of the element to retrieve. Since Python is 0-based, [0] is the first element in the array. Therefore, [2][1] is the first element of the second element! Here is a great resource for Indexing in Python. As practice, guess what the previous code snippet will return. The answer will be in the footnotes 3
Slicing lets us manipulate our matrix by cutting out specific parts. We will continue using the data variable from the previous example. If we want to access the first two objects inside data, we can write out the following line of code:
data[0:2]
the [0:2] lets our computer know we only want objects from the 0th index, up to the 2nd index (exclusive4). Here are the rules for slicing:
data[x:y]returns an object with elements from the xth index to yth indexdata[x:]returns an object with all elements starting from the xth indexdata[:y]returns an object with all elements up till the xth index
2.3. Reshaping and Flattening
Sometimes we need to reshape our data to execute certain operations on it. NumPy comes with a .reshape() function which takes in two arguments, the number of rows and columns
Input:
a = np.array([1, 2, 3, 4, 6])
b = a.reshape(3, 2)
Output:
array([1, 2, 3, 4, 5, 6])
array([0, 1],
	  [2, 3],
	  [4, 5] )
We reshaped our flat array a to have 3 rows and 2 columns. NumPy also has a function to go from an arbritary shape array back to a flat array.
Flattening our data gets rid of the dimensionality, and turns our higher dimensional data into a 1-D vector.
Input:
c = b.flatten()
Output:
array([1, 2, 3, 4, 5, 6])
No parameters are needed, since it will always turn the array back into a one dimensional list.
Reshaping and flattening are crucial operations for making sure our data is compatible with certain operations, such as matrix multiplication. If the dimensions don't match, we can reshape our data to fix it.
3. Pandas
Moving on, we will cover the basics of pandas. Once again, here is the link for the comprehensive documentation
3. 1. Dataframes
Pandas is used for two-dimensional tabular data, such as data stored in spreadsheets. The most common datatype we work with in pandas is called a DataFrame. Let's make one right now.
import pandas as pd
df = pd.DataFrame(
     {
         "Name": ["Avni", "Aryaman", "Sofia", "Manik", "Grace", "Priyal"],
         "Sex": ["female", "male", "female", "male", "female", "female"],
     }
 )
Here is a table of the current projects division board members. If we print it out, we would get the following |index|Name|Sex| |---|---|---| |0|Avni|female| |1|Aryaman|male| |2|Sofia|female| |3|Manik|male| |4|Grace|female| |5|Priyal|female|
Similar to NumPy, pandas has functions and indexing features allowing you to return rows and columns.
df["{column_name}"]returns the column corresponding to the column namedf.iloc[x:y]returns the rows ranging from indexxto indexy(exclusive)
3.2. Reading and Writing
Most likely, you will be creating dataframes with pre-existing csv files from data collection. Luckily, Pandas supports the ability to read from these files
data = pd.read_csv("directory/data.csv")
The variable data has a type DataFrame, which means all the previous functions we used can be applied here as well.
data.head(x)will display the firstxrows of the dataframedata.tail(x)does the opposite and displays the lastxrows of the dataframedata.shapereturns the shape of our dataframe
To write out the tabular data we have manipulated, we can use the function
df.to_csv("board_members.csv", sheet_name="board")
Here is a link for a more comprehensive guide towards dataframe indexing
4. Conclusion
This Python tutorial covered important libraries that will be relevant to your work in signal pre-processing and manipulation. Libraries such as NumPy and Pandas come with a vast amount of functionality, allowing users to focus on meaningful work, and generate results quickly.
sometimes python decides to be funny and requires you type pip3 instead of just pip. Please be mindful of what python version you have installed. If it's Python3, do the former.
2: When choosing a nickname, make sure it's intuitive as to what library it's referring.
3: [1 7 3 9], 3, [8 6 0 2], IndexError. An IndexError occurs because there is no value at the [5] index of our variable.
4: By exclusive, we mean that data[0:2] will not include the element at the 2nd index
Overview of Neuroscience and EEGs
By Aryaman Bhatia and Grace Lim for Neurotech@Davis
Here, we discuss the underlying neuroscience related to EEGs and Event related potentials, and learn about the electrical knowledge behind EEGs.
What is EEG?
EEG stands for Electroencephalogram, which is a method for recording electrical brain activity. Like the name suggests, EEG uses electrodes (for our purposes, on the scalp), to pick up neural activity from a local cluster of neurons beneath the skull. This neural activity is thought to be is specifically generated from post-synaptic potentials from pyramidal cells. These post-synaptic potentials along the cortex create a summation of dipoles which are picked up from the electrodes, which gives rise to the voltage recorded from the scalp. This works in a way of volume conduction, where this propagation of current causes this instantaneous voltage (Luck, 2014, Chapter 2).
Strengths and limitations
The main strengths for EEG are its good temporal resolution, accessibility, and non-invasiveness (for scalp EEG). For people doing EEG-based projects, the main draw should be the use of temporal resolution (e.g, measuring latency in responses or waveforms, in relation to brain activity). However, there are quite a few relevant limitations to EEG; those being its spatial resolution and noise. Spatial resolution refers to our ability to localize activity from the brain. If temporal resolution is the “when”, then spatial resolution is the “where”. The other drawback is noise. Since EEG is picking up electrical activity from our brain, you can imagine all the other kinds of background electrical that can contaminate your data. For example, the most obvious would be the 60Hz line noise if you are in the US. Knowing this, there are several ways to clean up your data, which we will explain in later articles or in the suggestions for further reading.
Active, Reference, Ground
The active, reference, and ground are three different types of electrodes that are combined to provide a single channel of EEG. This is because EEG is always recorded as potential for current to pass from one electrode (active) to usually a ground electrode (Luck, 2014, Chapter 5). If this concept of electricity and magnetism is confusing, I highly recommend reading Luck’s second chapter “A Closer Look at ERPs and ERP Components”. The term “absolute voltage…refer[s] to the potential between a given electrode site and the average of the rest of the head”, (Luck, 2014, Chapter 5). What this means is that the potential between the active electrode and the ground electrode is simply the difference between these two absolute electrodes. If you are familiar with basic physics, then you can understand why there is no voltage at a single electrode: you have to have voltage from two sources for everything because voltage is the potential from one source to another.
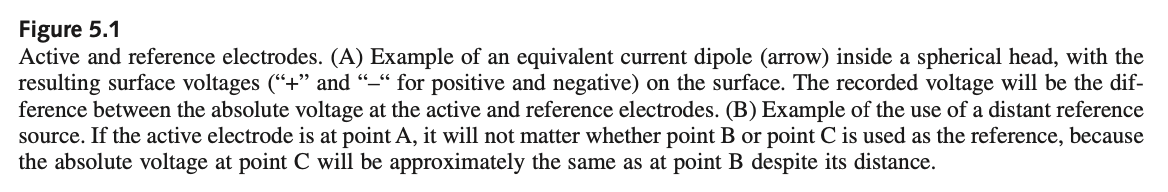
For some background when describing the reference electrode, it is important to know that EEG recording systems typically solve the problem of noise in the ground circuit by using what are called differential amplifiers (Luck, 2014, Chapter 5). The reference electrode, in theory, is supposed to be away from the brain activity we are directly measuring, using it to subtract from each active and ground electrode. This makes sense practically, as we are creating a sort of baseline for recording neural activity in order to get rid of any common noise. Here is a section from one of the figures used from Luck in the fifth chapter, that helped me understand this concept:
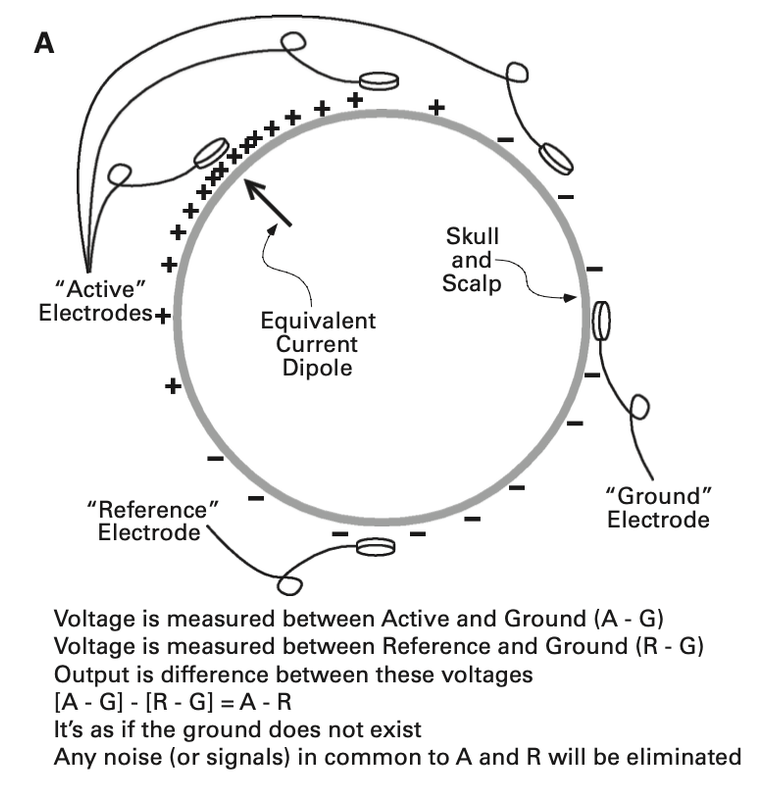
The purpose of the ground electrode can be described as “when voltage is initially measured between two electrodes, one of the two electrodes must be connected to the amplifier’s ground circuit, and this circuit picks up noise from the amplifier circuitry”, (Luck, 2014, Chapter 5). You also may now be wondering why we can’t record the voltage directly between the active and the reference, but the reasoning for this is because “without connecting R to the ground circuit (in which case it would simply be the ground electrode). Thus, most systems use a differential amplifier to cancel out the noise in the ground circuit”, (Luck, 2014, Chapter 5).
To tie all these concepts together, you should know that “the electrical potential between the subject’s body and the amplifier’s ground circuit is called the common mode voltage (because its common with the active and ref electrodes)” and that “to achieve a clean EEG recording, this common mode voltage must be completely subtracted away”; however, this is not as perfect in implementation (Luck, 2014, Chapter 5).
For practical implementation of these ideas: the location of the ground electrode is trivial, so feel free to place it anywhere on the head. However, the site of the reference electrode requires a little more thinking. Luck provides some advice: “given that no site is truly electrically neutral, you might as well choose a site that is convenient and comfortable”, “also close to the site of interest and one that other researchers use”, and “you want to avoid a ref site that is biased toward one hemisphere”, (Luck, 2014, Chapter 5). I would recommend for our purposes to place your reference on the electrode on the mastoid(s) to stay consistent with other researchers.
ADC
As you may know, your brain waves are a continuous process (I would hope so), so we call this an analog signal. When we record brain activity through the EEG, the computer is undergoing a process called digitizing the EEG. This means “the EEG is an analog signal that varies continuously over a range of voltages over time, and it must be converted into a set of discrete samples to be stored on a computer”, (Luck, 2014, Chapter 5). You can think of these samples as a point in time. This is where the principle of sampling rate comes in: “The continuous EEG is converted into these discrete samples by a device called an analog-to-digital converter (ADC)” and “the sampling period is the amount of time between consecutive samples (e.g., 4 ms), and the sampling rate is the number of samples taken per second (e.g., 250 Hz)” (Luck, 2014, Chapter 5). 1 Hz is equivalent to 1 cycle per second, you can do the math! Another important concept to understand when talking about sampling rate is the Nyquist Theorem: “which states that all of the information in an analog signal such as the EEG can be captured digitally as long as the sampling rate is more than twice as great as the highest frequency in the signal” (Luck, 2014, Chapter 5). The reason this is important, is because of aliasing: if you sample at lower rates, you will induce artifactual low frequencies in the digitized data. If this is confusing, think of a real world example of aliasing: car tires turning backward when going fast bc our eyes aren’t sampling fast enough.
What is an event related potential?
An event related potential, as the name suggests, represents changes in electric potential in response to an event, for example a light flashes to the test subject as part of an experiment, which are caused by a neural site in the brain.
More formally, an event related potential, or ERP, is defined in (Luck, 2014) as follows. “An ERP component can be operationally defined as a set of voltage changes that are consistent with a single neural generator site and that systematically vary in amplitude across conditions, time, individuals, and so forth. That is, an ERP component is a source of systematic and reliable variability in an ERP data set.”
This means that if an ERP component exists, it can be consistently seen occur in other experiments, with slight changes depending on the conditions, time, individual etc, caused by the same neuroanatomical site.
How are ERPs generated?
Now let’s look at the underlying biology of how ERPs are generated. Most ERPs are generated as a result of postsynaptic potentials. Postsynaptic potentials are the voltages that occur when neurotransmitters bind to the receptors of postsynaptic cell.
Mainly, ERPs are resulted due to pyramidal neurons, which are the most populous cells of the excitatory type of cells brain. The following is a diagram showing the structure of the same.
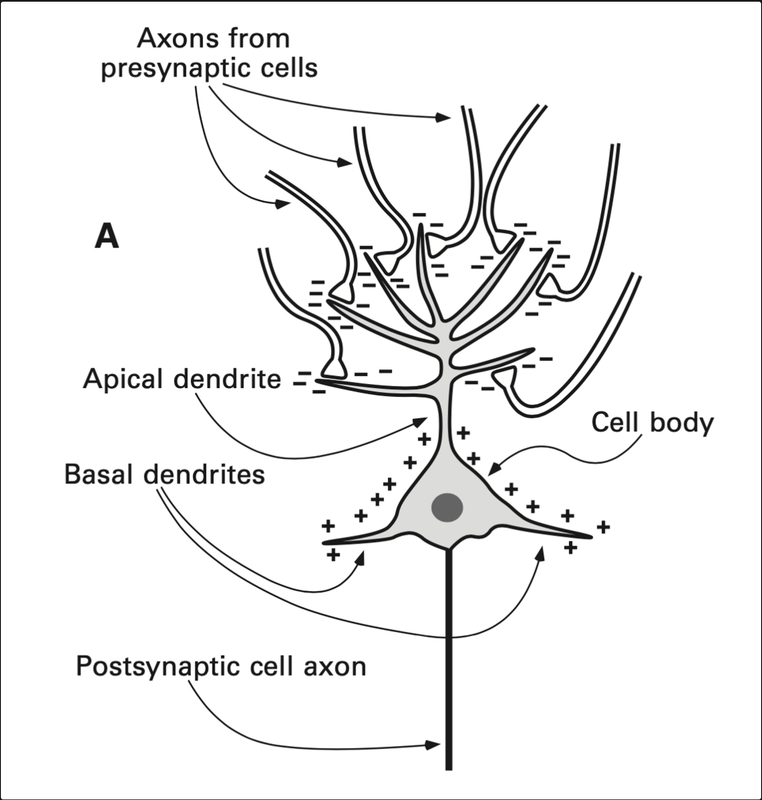
When an excitatory neurotransmitter is released, electrical current in the form of positively charged ions will flow from the extracellular space into the cell, making a negative charge in the region of the apical dendrites. To complete the circuit, current flows out of the basal dendrites, creating a dipole, which refers to (https://byjus.com/question-answer/what-is-an-electric-dipole/) a pair of electric charges of equal magnitude but opposite sign, separated by some (usually small) distance. (When the neurotransmitter is inhibitory, the flow of current is opposite, so the polarity of the recorded signal is the opposite. But as polarity usually doesn’t tell us much, it is not something you have to worry thinking about.) Put simply, it is the summation of multiple of these dipoles from around the brain, when certain conditions are met, that produces the measurable voltage in the EEG.
Large numbers of neurons must be activated at the same time. • The individual neurons must have approximately the same orientation. • The postsynaptic potentials for the majority of the neurons must arise from the same part of the neurons (either the apical dendrite or the cell body and basal dendrites). • The majority of the neurons must have the same direction of current flow to avoid cancellation.
When you look at an ERP waveform, it is actually the weighted sum of multiple components in the brain. By weighted, we mean that each component waveform has a weighting factor, that is determined based on the location from where it is coming, the orientation of the dipole and the conductivity of tissues that form the head. The following diagram illustrates this:
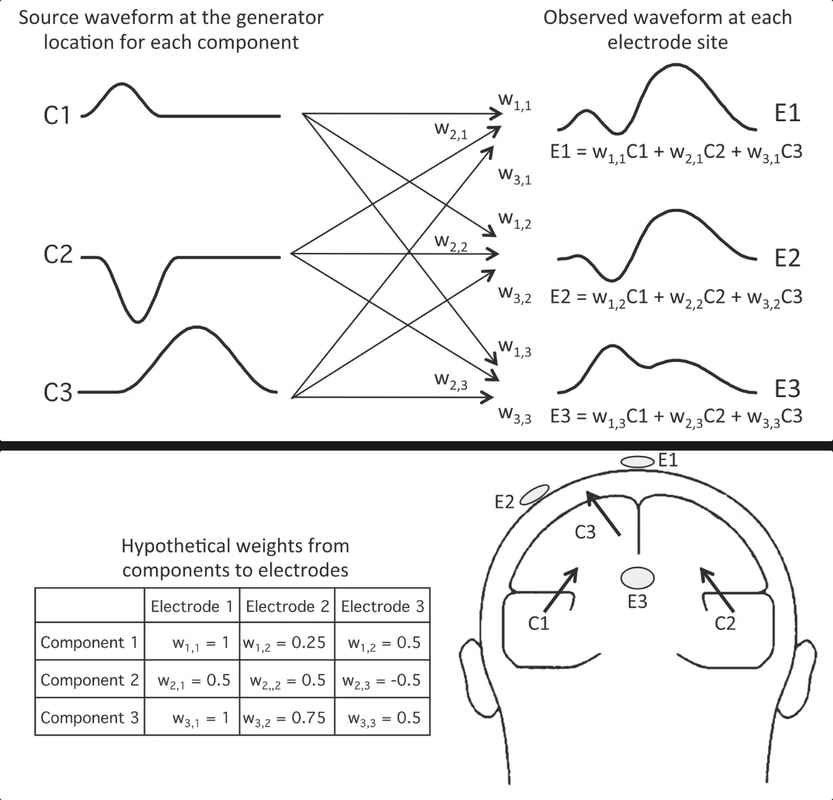
Here, C1, C2, C3 represent the represent the waveforms at different locations in the brain. Each of them is then multiplied by the corresponding weights, and then all are summed up to give us the waveform that is picked up by the electrodes at their respective site.
While this example shows three components, in general the voltage at a given electrode site is the result of almost all the underlying components in the brain. Electrodes can pick up dozens of components in the brain during recording. There is no foolproof way of identifying which exact components result in the observed waveform. This is called the superposition problem.
All in all, when looking at your waveforms in the OpenBCI GUI, know that they are the result of the weighted sum of multiple other electrical signals in and around the electrode site, and not the singular exact signal of that site.
ERP components
First, a participant is shown a stimulus.
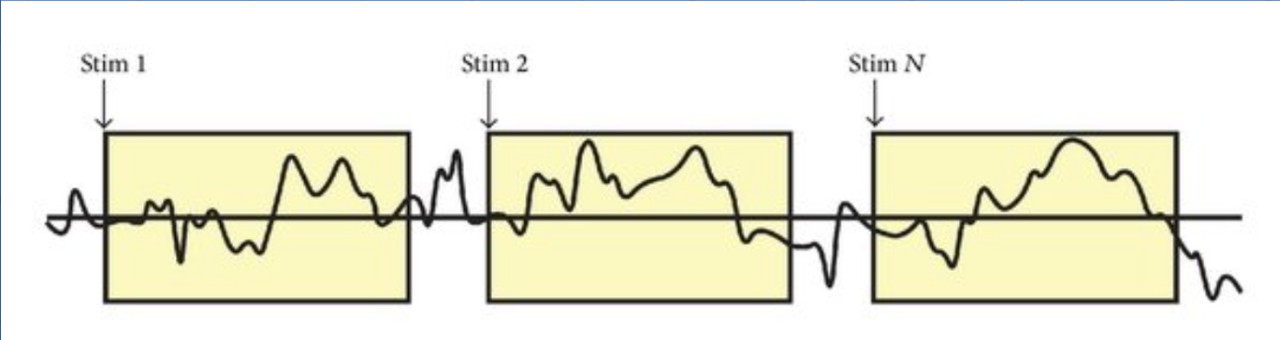
We see here that each time the participant is shown that stimulus, the corresponding brain waves look very different each time. This is because the brain is doing many things at one point in time, and the EEG records all of it. So each of these segments represent the combined brain activity of everything it is doing in that moment.
So how do we isolate the brain activity for just the stimulus? For that, we do something called averaging.
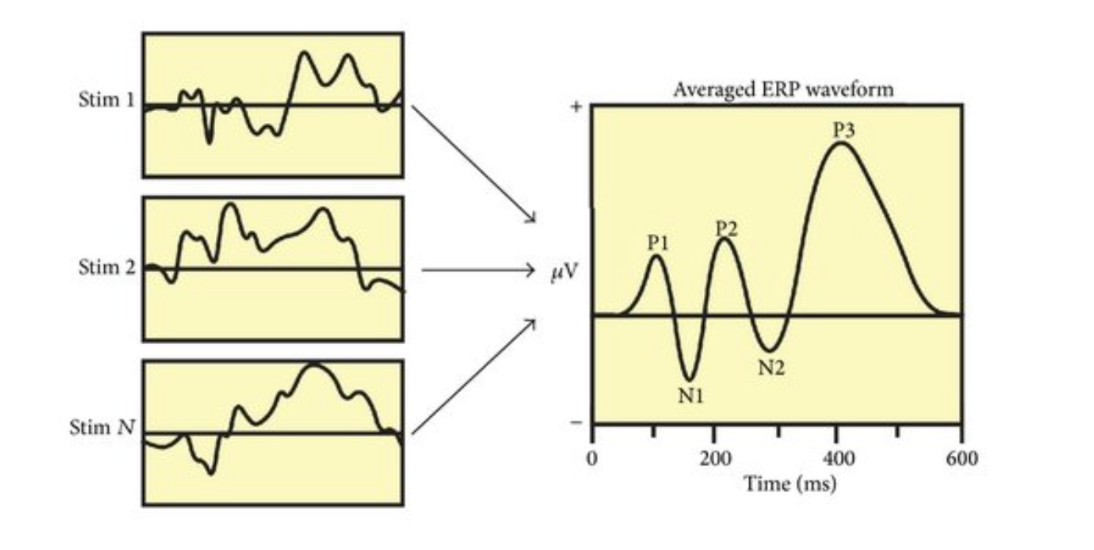
Here, we take all the segments and average them out, which removes the other brain activity, leaving behind the consistent brain response that our brain has for that stimulus. ERPs are small relative to the noise level and many trials are usually required to accurately measure a given ERP effect. You must have usually 10 to 500 trials per condition in each subject to achieve sufficient statistical power.
Some examples of some common ERP are the P300 and N170. This is a positive deflection in the EEG signal that occurs about 300ms (approximately) after a stimulus. It's associated with decision making, attention, and memory processing. The P300 is often studied using the "oddball paradigm". This is an experimental design where participants are presented with a sequence of stimuli where one type of stimulus (the "oddball") occurs infrequently among more common stimuli. When participants detect the oddball stimulus, it typically elicits a larger P300 response, reflecting the allocation of attention to the rare event.
The N170 is a negative deflection occurring about 170ms after stimulus onset. It's particularly responsive to face stimuli and is thought to reflect early stages of face processing.
It is important to note, however, that not all mental processes have an ERP signature. This can be because the signal may be too deep in the brain to be picked up by surface level electrodes, or the neural process occurs too fast. Hence, it may be difficult to find any clear contribution to the scalp-recorded voltage.
Cleaning your data
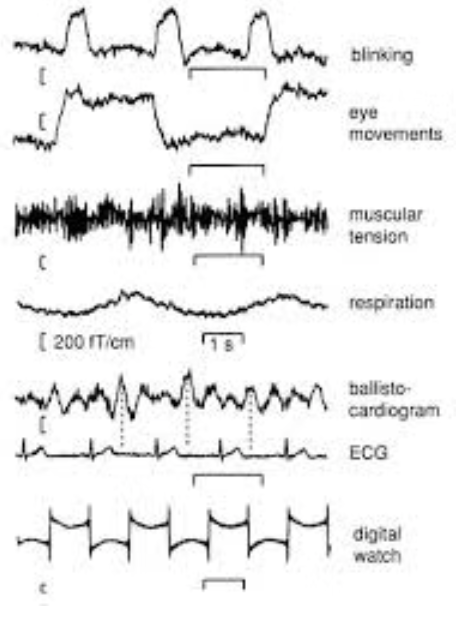
When you have finally collected all your data, your data will consist of both EEG data and unwanted electrical data not related to your experiment. This could include things such as electrical signals from lights and computers, eye blinks, muscle activity, etc. which are unrelated to your experiment. These are called artifacts.
It is important to get rid of these as they can cause unwanted peaks and distortions to your data, make it unreliable to find the actual ERP from your experiment.
There are two methods for dealing with artifacts: artifact rejection and artifact correction. Artifact rejection involves identifying and removing segments of data that contain artifacts. Artifact correction attempts to remove the artifact while preserving the underlying neural signal. There are multiple ways to do this, and one that has been discussed below is Independent Component Analysis. There are other methods which have been linked.
Blinks
A very common artifact is blinking. Each eye has a constant electrical potential between the cornea and the retina. The voltage recorded from electrodes near this site are called electrooculogram, or EOG as you may see labelled in MNE. When the subject blinks, this potential is changed, causing the artifact.
Blinking is also a good way to make sure your headset is recording data. Tell your subject to blink rapidly, and some very obvious deflections should occur. You can also do jaw clenches.
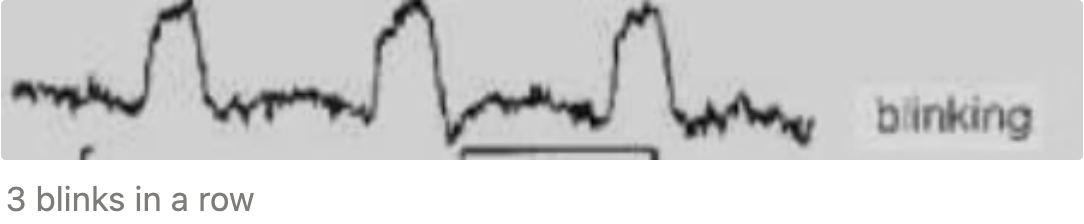
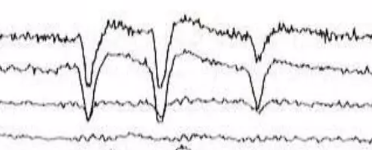
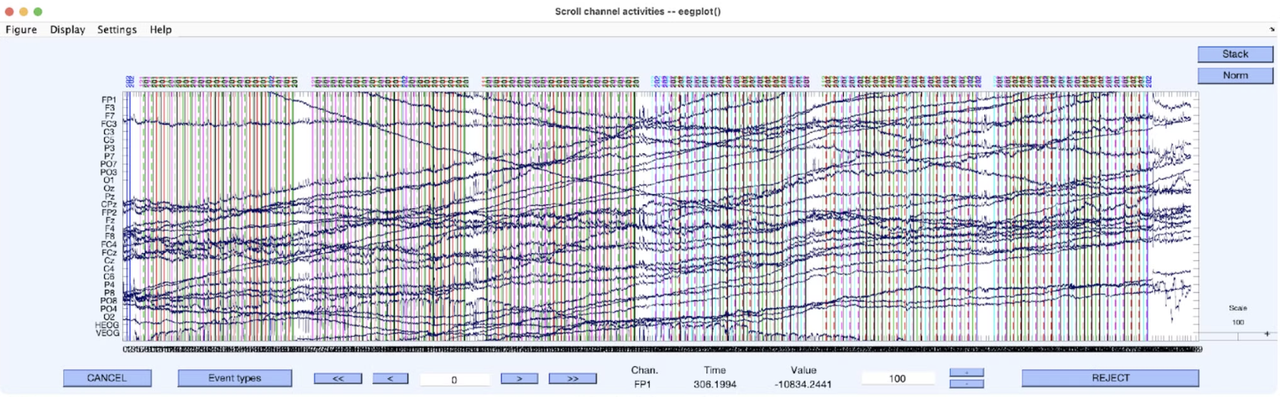
Blink potentials are such that they have negative polarity under the eye, and positive polarity over the eye. Here, you can see the negative polarity in the vertical EOG and see the difference between a blink and not a blink.
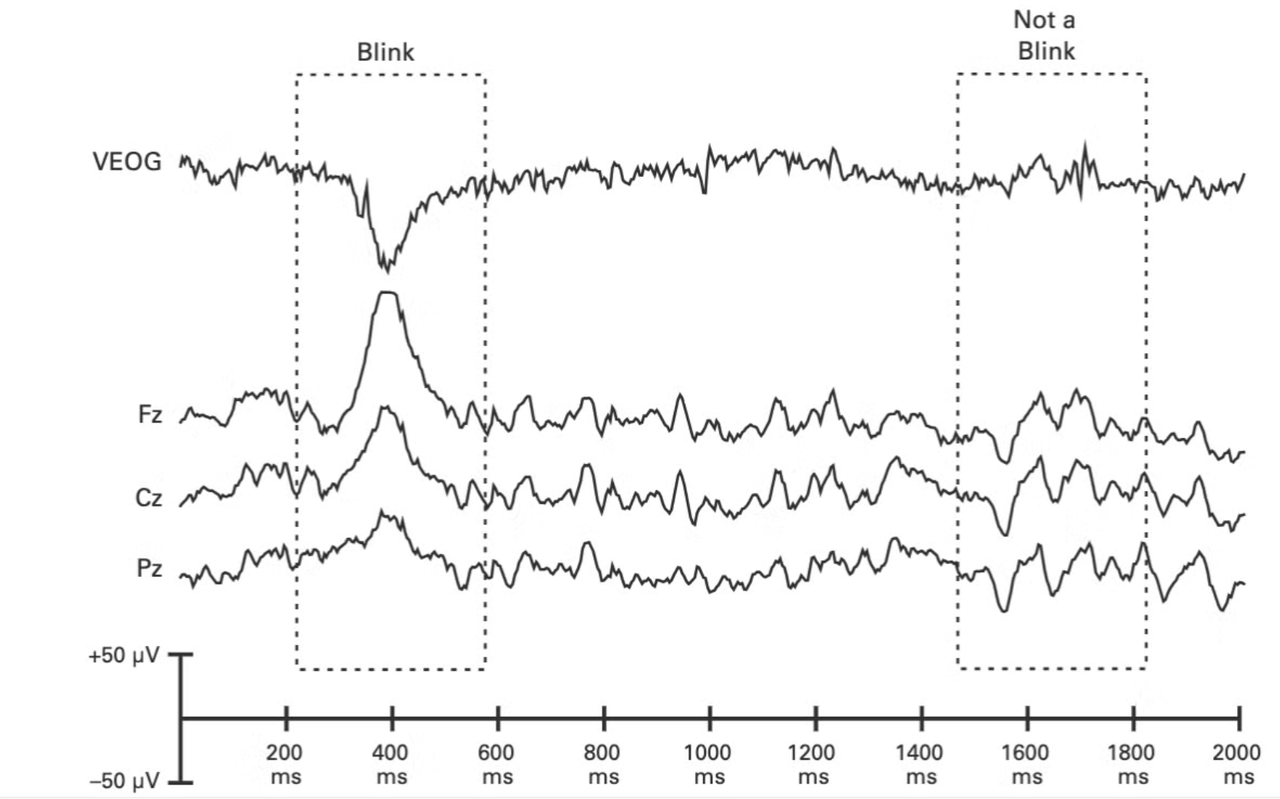
Since there is a clear negative polarity, one method of removing these artifacts is to conduct two separate recordings, one with the electrode below the eye and one above. You can then subtract the lower -minus the upper (lower - upper) and see the eye blink to see them even more clearly.
In MNE, you can also use the functions create_eog_epochs() which takes the artifacts and puts them into epochs. You may need to fine tune the functions parameters before using it, so be sure to have a look at the documentation in case you don’t. https://mne.tools/stable/auto_tutorials/preprocessing/10_preprocessing_overview.html#ocular-artifacts-eog
Eye movements
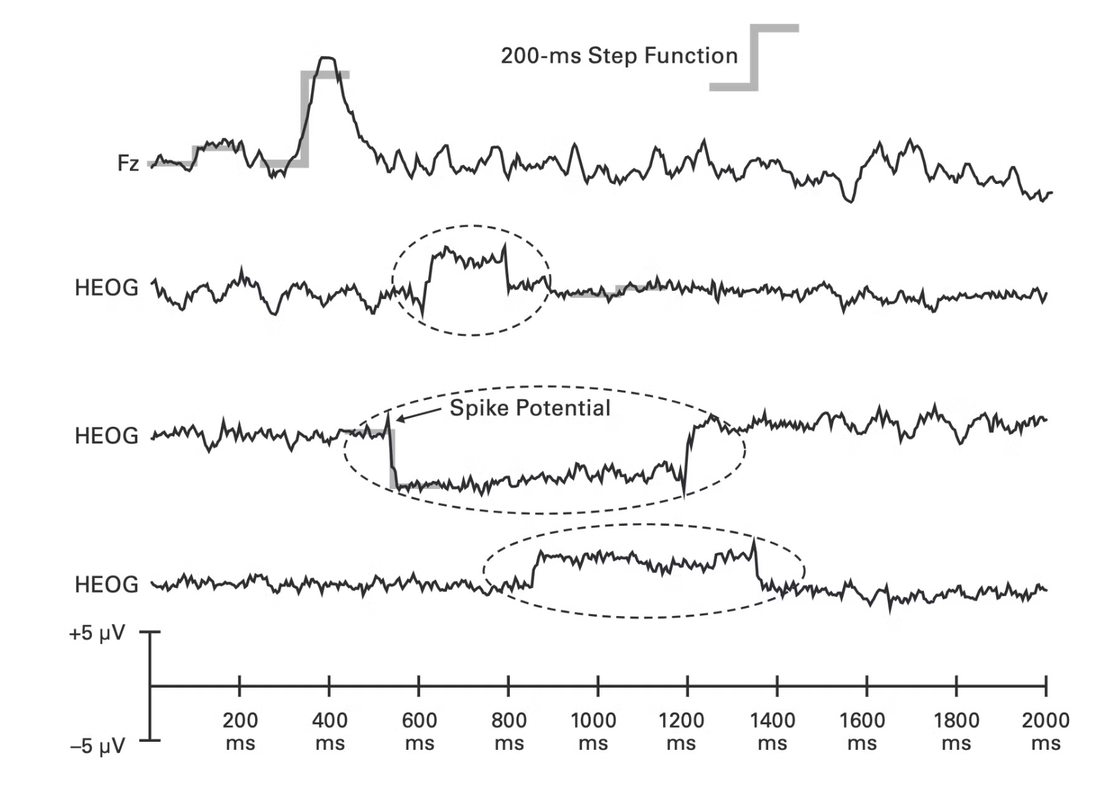
As in eye blinks, eye movements also result from the dipole in the eye. The front of your eye has positive charge. When you turn to a certain direction, positive charge gets accumulated in that part of the face, and negative on the other side.
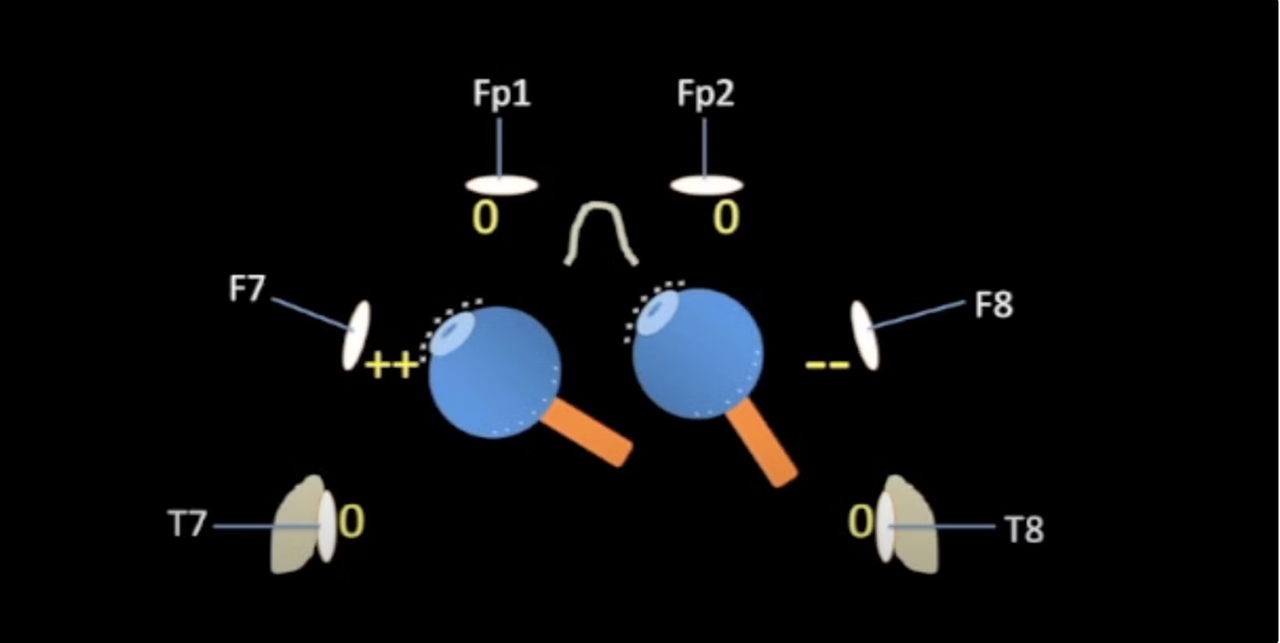
In general, eye movements show a sharp movement deflection in the waveform and then back to original position as below. HEOG stands for horizontal eog.
You can also use the create_eog_epochs() function in MNE. Again, make sure to see if you need to fine tune the function before using it. https://mne.tools/stable/auto_tutorials/preprocessing/10_preprocessing_overview.html#ocular-artifacts-eog
Low voltage drifts
Low voltage drifts are caused by small movements in the position of the electrode, which can be due to the subject moving during the experiment or sweat. The change in movement causes impedance to change, leading in sustained shift in voltage.
It often looks something like this, and can be detected by visual inspection
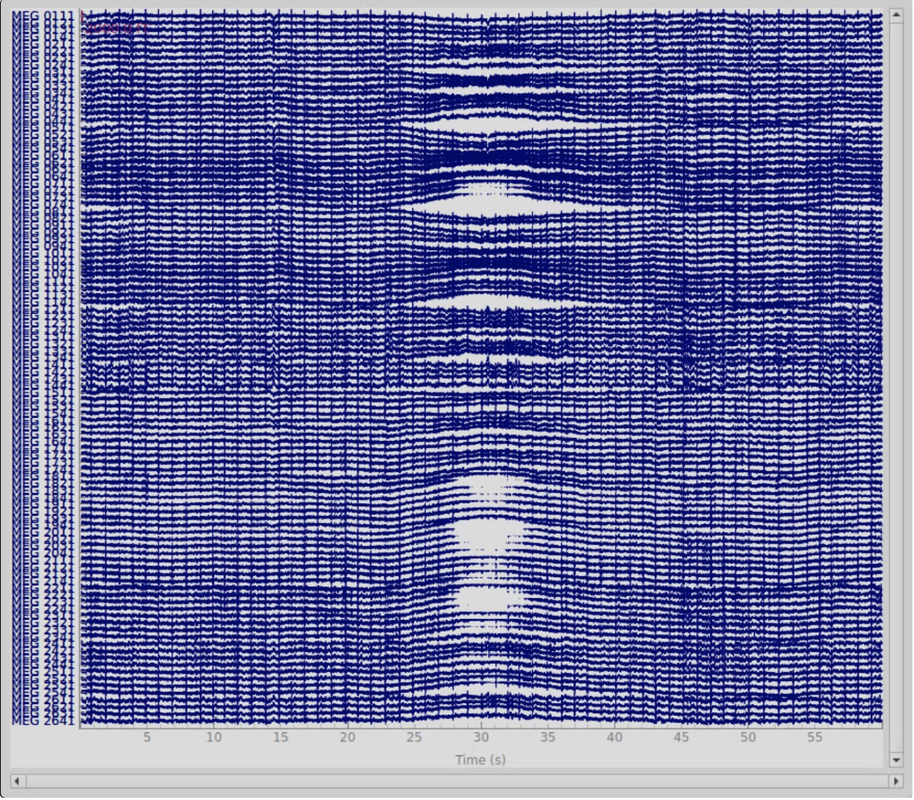
It’s a good idea to zoom out in your program and observe these drifts. You can remove these by applying a high pass filter and making sure the subject does not move much during the experiment. (Normally 0.1Hz, but may be subject to change based on your data)
Power line noise
For detecting power line noise, first convert your data into frequency domain. Then, notice if there is any large spike at the 60Hz mark. Apply filter to remove this. EZ
Muscle and heart activity
Muscle and heart activity can create significant artifacts in EEG recordings. Muscle artifacts are typically caused by tension in facial or neck muscles, which can produce high-frequency noise in the EEG signal. These artifacts are often characterized by sudden, sharp spikes or sustained periods of high-frequency activity.
Heart activity, particularly the QRS complex of the heartbeat, can also introduce artifacts into EEG recordings. These are known as electrocardiogram (ECG) artifacts and appear as regular, rhythmic spikes in the EEG data.
Speech can also create artifacts due to the movement of facial muscles and changes in skull pressure. These artifacts are often more complex and can vary based on the individual and the type of speech.
To detect and remove these artifacts, MNE-Python provides several functions. For muscle artifacts, you can use create_eog_epochs() or create_ecg_epochs() to identify epochs containing these artifacts. For heart-related artifacts, the find_ecg_events() function can be useful. These functions help in identifying and potentially removing segments of data contaminated by muscle and heart activity.
It's important to note that while these artifacts can be problematic, they also contain valuable physiological information. Therefore, careful consideration should be given to the balance between artifact removal and preservation of relevant neural activity.
Independent Component Analysis (ICA)
Independent Component Analysis (ICA) is a powerful technique used in EEG data processing to separate and remove artifacts from the signal. It's particularly useful for dealing with complex artifacts that are difficult to remove using simple filtering methods.
Here's how ICA works in the context of EEG data cleaning:
- Decomposition: ICA decomposes the EEG signal into statistically independent components. Each component represents a source of activity, which could be brain activity or an artifact.
- Identification: After decomposition, components that represent artifacts (e.g., eye movements, muscle activity, or heartbeats) are identified. This can be done manually by visual inspection or using automated methods.
- Removal: The identified artifact components are then removed from the data.
- Reconstruction: Finally, the cleaned EEG signal is reconstructed using the remaining components.
ICA is particularly effective for removing ocular artifacts (like eye blinks and movements) and can also help with other types of artifacts that have consistent spatial patterns.
In MNE-Python, you can perform ICA using the mne.preprocessing.ICA class. Here's a basic example of how to apply ICA:
from mne.preprocessing import ICA

# Create ICA object
ica = ICA(n_components=20, random_state=97)

# Fit ICA
ica.fit(raw)

# Plot ICA components
ica.plot_components()

# Apply ICA to the raw data
raw_clean = ica.apply(raw)
Other methods include:
https://mne.tools/stable/auto_tutorials/preprocessing/35_artifact_correction_regression.html
https://mne.tools/stable/auto_tutorials/preprocessing/50_artifact_correction_ssp.html
Oscillations
An neural oscillation is the rhythmic and/or repetitive electrical activity generated spontaneously and in response to stimuli by neural tissue in the central nervous system. https://www.ncbi.nlm.nih.gov/pmc/articles/PMC3811101/#:~:text=The term “brain (or%20neural,processes%20has%20become%20increasingly%20evident.
The following discusses some common neural oscillations.
Alpha waves
Alpha waves are a type of brainwave associated with a relaxed yet alert state of consciousness. They typically have a frequency range of 8 to 13 Hertz (Hz) and are often observed when a person is awake but in a calm and unfocused state, such as during meditation or daydreaming. Alpha waves are characterized by regular, smooth oscillations and are commonly found in the posterior regions of the brain. Their presence can be an indicator of a relaxed mind.

Beta waves
Beta waves are higher-frequency brain waves ranging from 13 to 30 Hz. These waves are associated with active, alert, and focused mental states. When you're awake, engaged in problem-solving, or concentrating on a task, your brain often generates beta waves. They are prevalent in the frontal and central regions of the brain and are linked to cognitive functions like attention, decision-making, and active thinking.

Theta waves
Theta waves have frequencies ranging from 4 to 7 Hz. They are commonly found during light sleep, meditation, and deep relaxation. Theta waves are also associated with creative thinking, intuition, and the early stages of memory formation. When you experience vivid dreams during REM (rapid eye movement) sleep, your brain often produces theta waves, contributing to the dream experience.

Gamma waves
Gamma waves are the fastest brainwaves, with frequencies exceeding 30 Hz. They are thought to play a role in complex cognitive processes, such as memory, perception, and consciousness. Gamma waves are often associated with the binding of sensory information and the integration of different brain regions' activities. Their presence is vital for forming coherent thoughts and experiences. Please note that it is currently impossible to record true gamma oscillations from scalp EEG; this is typically achieved through intracranial recordings.

Delta waves
Delta waves are slow brain waves with frequencies below 4 Hz.
They are predominantly observed during deep sleep stages, such as Sleep Stages 3 and 4.

Important note: While frequency bands are often labeled with specific ranges (e.g., alpha: 8-13 Hz), the function of oscillations in the same frequency range can differ depending on the brain region and the context in which they occur.
For example, Mu oscillations (8-13 Hz) over the motor cortex are related to motor functions, such as motor planning, execution, or the inhibition of movement. In contrast, alpha oscillations (8-13 Hz) over the visual cortex are associated with attention and sensory processing, often linked to the suppression of visual input when not actively engaged in a visual task.
This highlights that the same frequency band (e.g., 8-13 Hz) can reflect different processes depending on the brain area and context. So, while the frequency range is consistent, the meaning and function of those oscillations are not. Frequency bands don't necessarily always map strictly to specific neural processes; the spatial location and task demands are critical in determining their role.
Filtering
Let us now discuss filtering. Before we discuss filtering, let’s make sure we understand well exactly what is going on when we look at a waveform in our program.
A filter suppresses or passes frequencies, which can be used to remove noise and isolate certain frequencies. A filter can be represented as follows:
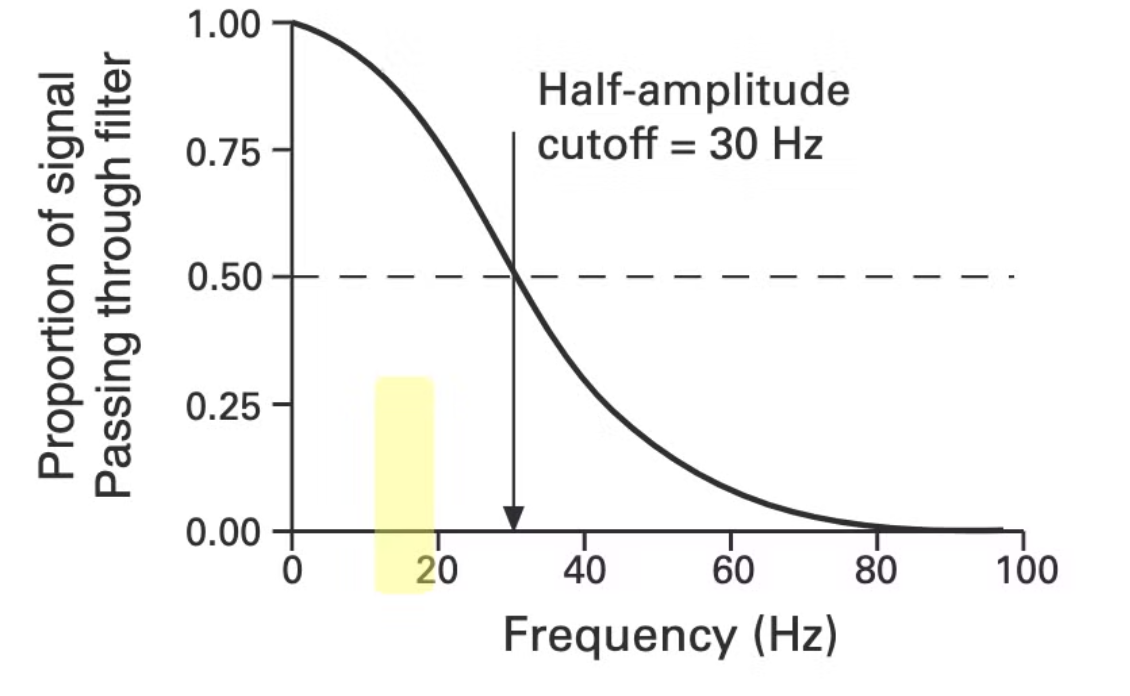
This is called the frequency response function of the filter. This function shows exactly what how much of the frequency it will let pass from the waveform. For example, when we convert our waveform to the frequency domain, the frequency 30Hz will get halved, and the frequency 80Hz will get removed, ie filtered out.
Now that we know what a filter is, let’s talk about some different types of filters and how to use them.
Low-pass filter: A low pass filter, or a high block filter, is a filter that allows frequencies lower than the specified frequency to pass and blocks any filters higher than the number.
High-pass filter: A high pass filter, or a low block filter, is a filter that allows frequencies higher than the specified frequency to pass and blocks any filter lower than the number.
Notch filter: Removes one frequency and passes the rest.
Band-pass filter: Combination of low pass and high pass. You can define the low end and high end of which frequencies you want to pass or keep.
When should you filter?
In general, it is a good idea to filter between 0.1-30Hz. The 0.1Hz helps fix the drifts as discussed earlier in our experiment, and the 30Hz can help counteract muscle movements and line noise, however should change this based on your experiment. Here are some more special cases to help you select a filter:
- If you are looking at slow or late components, you can consider using 0.1Hz or 0.05Hz
- If you are looking at responses which happen under 50ms such as the auditory brainstem response, you should use higher cutoff frequencies for both low-pass and high-pass filters. You should do some research before selecting them.
Citations
Luck, Steven J. An introduction to the event-related potential technique. MIT press, 2014.
https://www.researchgate.net/figure/The-event-related-potential-ERP-technique-A-raw-EEG-record-is-punctuated-by-the_fig3_299472589
https://www.researchgate.net/figure/Brain-wave-samples-with-dominant-frequencies-belonging-to-beta-alpha-theta-and-delta_fig1_364388814
https://mne.tools/stable/index.html
https://www.youtube.com/watch?app=desktop&v=-71ppPF02qw
Overview of EEG Experimental Design
By Sofia Fischel and Grace Lim for Neurotech@Davis
General Structure of EEG Experiments
The general structure of EEG experiments consists of four main components: stimuli, trials, participants, and responses. Stimuli is a physical item or event that the participant is reacting to. It can take any form, but usually the type of stimuli informs the design of the experiment. For example, some common stimuli presentations are the Posner cueing task, Stroop test, and detection of stimuli (using luminance). The type of stimuli used must be specific to purposely not elicit any unwanted behavior. These are known as sensory confounds, which will be covered later in this article. A trial defines how long a participant is presented with a stimulus (stimulus onset) and their response. More importantly, the researcher needs to think about how many trials will be done by the participant. Typically, a set number of trials is defined by a block. For example, you may have 50 trials within a block and have 10 blocks total. The reasoning for splitting it up like this is to organize your data, especially if you plan to manipulate some stimuli within blocks or simply to have a time to give the participant a break. There is no commonly set amount of trials, so it’s best to refer to previous research done on a similar topic to figure out this aspect of design. Another component of the experiment is the participants. The researcher must consider how many participants they will have complete the experiment as well as the demographic. If you are not interested in a specific subset of the population, it is best to diversify the participant pool (age, sex, location, etc…). Another thing to consider is that participants may choose to drop out of your study at any time, as well as not be able to meet some benchmark, causing you to exclude them from the final results. The last aspect of the experiment is the response, which is defined by how the participant is responding to the stimuli. This can be intentional through a keyboard click or less intentional by passively viewing their EEG results while they view the stimuli. In order to calculate things like reaction time or accuracy, you will need to have an intentional response.
This is a very general outline of what is needed for your experiment, so we will go more into detail about each topic later on in this article.
Overview
A well-designed experiment (for our consideration) will include the following characteristics:
“As simple as possible to operate for the experimenter and easy to reproduce for later researchers”$^{1}$.
Simplicity can be summarized as ease of collection. To average out the noise, many trials per participant are required. The more complex the trial, the more difficult it is to collect enough usable data. A little on the nose, I’ll keep this explanation as you should keep your design and trials: short and to the point!
Reproducibility is important in two regards: during successive repetitions conducted by your team and, as stated above, for those outside your team as well. You should be able to replicate similar results across numerous data collection periods; whether that be across different participants running the same trials, or the same participant across numerous days, there is no use in a procedure that yields inconsistent results.
Additionally, your experimental design is not the place to cut corners; though your group may understand exactly what you mean when you write something like “participants will look at the stimulus for 30 seconds,” others with no experience viewing your exact procedure will be left confused and bewildered. Research and projects are meant to be seen by others! A good, standard rule of thumb is to imagine that you have never seen your project before and, with only the experimental design as a guide, you must replicate its results fully.
In practice, components of your experimental design may look something like this
- Paradigm or particular wave of interest
- Applicable brain regions involved
- Key electrode regions outlined (and a brief explanation for their inclusion)
- Layout of blocks/trials
- Includes stimuli [specifically for exogenous BCI designs, or designs that utilizes brain activity that is generated in response to external stimuli)] + participant response [determine if passive (viewing a screen, attending to a noise, etc.)] or active (verbal response, button press, etc.)]
- Determine length (SOA, ITI, etc.) + number of trials
- Includes practice blocks (if necessary to accommodate to any experiment specific tasks + practice timing of any responses)
- Includes break/rest periods
Participants
In an attempt to ensure replicability beyond the confines of the experiment, an increased sample size is ideal to better replicate the general population as a whole. There is a trade off between open-field application of a project (increasing sample size) and ease of collection (decreasing sample size). Though of course it is easy to idealize the perfect list of candidates for an experiment, it is best to consider participant time constraints, as trials may be rerecorded numerous times given data usability.
Ethical Issues
Please ensure a basic level of respect and awareness for all participants. There should be no undue mental strain nor physical harm applied, and a fundamental principle from standard procedures will hold: “Each participant has the right to withdraw from the experiment without any reason or penalty”.
Electrode Placement
By Grace Lim for Neurotech@Davis

This figure depicts the International 10/20 System for electrode placement, which describes an Internationally recognized mapping for electrodes placed on the scalp. The letter describes the area of the brain the electrode is located, so for example, the “P” in P7 would stand for parietal lobe. The number describes the hemisphere and position of that electrode. For our purposes, the OpenBCI cyton board we use has the capacity for 8 electrodes, so if we wanted to use this map you would measure the distance from the nasion and inion using a measuring tape for standardization.
This map will come in handy as you focus on what kind of experiment you will create because you will want to focus your limited amount of electrodes on the area of interest. For example, if you were interested in studying visual attention for your EEG experiment, you would want to place electrodes on parietal and occipital regions. Areas near the frontal or temporal lobes wouldn’t be as important.
Impedance, Skin Potentials, Sweat
By Grace Lim for Neurotech@Davis
As you may know by now, if you are not careful in your collection of EEG data, most of what you are recording can be quite plainly crap. What I mean by crap is impedance to the electrode, which is “a combination of resistance, capacitance, and inductance and the properties of the skin, electrode gel, and the electrode can influence all three of these qualities” (Luck, 2014, Chapter 5). As the name suggests, there are many things that can impede the quality of the signal from the recording electrode. Most commonly this is the outermost layer of skin which includes oil and dead skin cells. “To assess the extent to which current can flow between the scalp and the recording electrode, it is important to measure the impedance rather than the resistance” (Luck, 2014, Chapter 5). Impedance is measured in ohms and as this measure increases, the ability to reject common mode noise decreases. This just means that the more impedance to the signal there is, the harder it is to reject the noise present from all electrode channels. The skills needed to physically reduce impedance are covered in the previous article on Intro to EEG.
Skin potentials are described by Luck as “a tonic voltage between the inside and the outside of the skin, and magnitude of this voltage changes as the impedance changes, thus if the electrode impedance goes up and down over time, this will lead to voltages that go up and down in EEG recording” (Luck, 2014, Chapter 5). This is why it is important to abrade the patch of skin the electrode will be placed on; to reduce the impedance from the skin potentials. You would do this by applying Nuprep or some other abrasive gel to the site of interest (usually the forehead for the frontal electrodes and the mastoids for your references) then wipe it off before putting the electrode on.
“The final major factor in determining the impedance between the outside of the skin and the electrode is sweat” (Luck, 2014, Chapter 5). The reasoning for this is actually quite intuitive if you are familiar with the properties of sweat; sweat contains salts making it conductive. Luck describes this issue as “the very gradual shifts caused by hydration of the skin are not ordinarily a problem, but the faster changes caused by the sweat glands can add random variance to the EEG and reduce your ability to find statistically significant effects” (Luck, 2014, Chapter 5). If you have the chance to view EEG data contaminated by sweat, it is actually obvious when it is occurring because it causes all affected channels to shift downwards. The way this is practically circumvented is making sure your participant is not hot while recording.
In addition, you can actually use this property to your advantage through the Galvanic skin response if you are interested in studying stress. What GSR is, is a measuring the skin’s change in electrical properties (sweat) while the participant is emotionally aroused. This is quite similar to what lie detector tests do! It is important to note however that GSR is not performed on the scalp, so it is not considered EEG and is instead used on someone’s hand/fingers.
Importance of Clean Data
By Grace Lim for Neurotech@Davis
Having clean data is one of the most important considerations for your EEG experiment, second only to participant safety (but we wont get into that now). The reasoning for the important of clean data is to save you time and money. By having clean data in the first place, you can reduce the amount of recording sessions you need to do; whether this is the amount of trials or number of participants being run. By have less sessions, you save lots of time and resources (electrode gel isn’t cheap). Besides these points, it is also just good practice as this is the standard for labs that publish papers. If you’re trying to impress your PI, you want to spend some time learning why and how to have clean data.
You may be tempted to just increase the amount of trials used in your experiment to circumvent the problem of bad data, but this is actually counterintuitive as “increasing the number of trials eventually has diminishing returns because the effect of averaging on noise is not linearly proportional to the number of trials” and “The noise decreases as a function of the square root of the number of trials in the average” (Luck, 2014, Chapter 5).
Now that you know why having clean data is important I will describe how to have clean data while you are recording, in addition to the preparation stage. A good amount of noise in the EEG recording can be attributed to skin potentials, which describes “the tonic voltage between the inside and outside of the skin. In addition, magnitude of this voltage changes as the impedance changes, thus if the electrode impedance goes up and down over time, this will lead to voltages that go up and down in EEG recording” (Luck, 2014, Chapter 5). A few steps to decrease noise due to skin potentials are to: use Nuprep, a type of abrasive gel used to prep the skin, having your participant wash their hair prior, having a cool room to reduce the amount of sweat produced, and removing any makeup on the skin where the electrode will be placed. Now to describe ways to reduce noise during recording: use medical tape to hold down electrodes (usually on the mastoids if referencing there), reducing any movements, ensure that the reference and ground electrodes are not being interfered, and giving the participant breaks to help them not get sleepy.
Sources of Noise + Ways to Minimize Them
By Sofia Fischel for Neurotech@Davis
Read more about artifacts here (includes practice and an atlas reference showing specific EEG recordings)
Much of the noise in EEG signals comes from “other biological signals such as skin potentials and from other non biological electrical noise sources in the environment” (Luck, 2014, pg. 149)
Source: Electrical devices in the recording environment.
Explanation: “The flow of current through a conductor is always accompanied by a magnetic field that flows around the conductor. Moreover, if a magnetic field passes through a conductor, it induces an electrical current. These two principles are illustrated in figure 2.1, which shows what happens when a current is passed through one of two nearby conductors. The flow of current through one of the conductors generates a magnetic field, which in turn induces current flow in the other conductor. This is how electrical noise in the environment (e.g., the 120 V in the video display) can induce electrical activity in an ERP subject, in the electrodes, or in the wires leading from the electrodes to the amplifier”. Additionally, electrical noise is present from electronic devices in the recording environment: phones, computers, etc., as well as power lines.” (Luck, 2014, pg. 38)
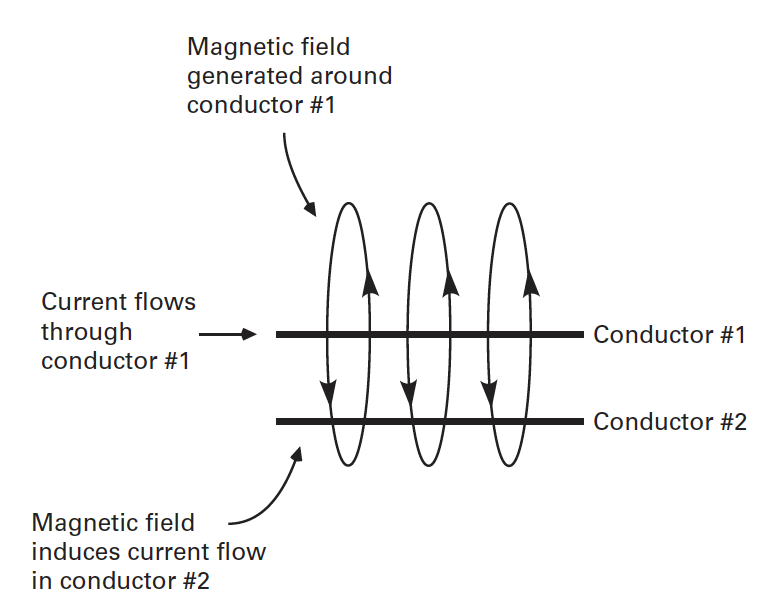
Figure 1, source: Luck, 2014
Solution: Though it is impossible to remove all environmental noise, placing nearby devices on airplane mode may reduce some. Further, applying a notch filter (at 60 Hz) to remove ambient electrical current that may remain from additional sources occurs during preprocessing.
Source: Biological signals from the participant
Source: Blinks
Explanation: “Within each eye, there is a large, constant electrical potential between the cornea at the front of the eye and the retina at the back of the eye (the corneal-retinal potential), which is like a dipole with positive at the front of the eye and negative at the back of the eye. This potential spreads to the surrounding parts of the head, falling off gradually toward the back of the head.” (Luck, 2014, pg. 194) “When the eyes blind, the eyelid moves across the eyes, which acts as a variable resistor that changes the EOG voltage recorded from electrodes near the eyes”.
Additional explanation: blink
Solution: One possibility is to ask participants not to blink during critical periods of the task and then provide cues for periods when they can blink freely.” However, “[a]s both blinking and spontaneous eye movement are automatic behaviors, withholding either of them requires voluntary attention that might interact with task performance as well as introduce EEG signal.” In fact, instructing participants to not blink may contribute to a lessened response: “Ochoa and Polich directly tested the possibility of dual-task interference by giving subjects an oddball task and either telling them to avoid blinking or saying nothing at all about blinking. The P3 had a smaller amplitude and a longer latency when subjects were asked to avoid blinking.” (Luck, 2014, pg. 211). In practice, spotting a blink within the raw EEG signal is not difficult; while recording, you can remind participants to limit blinks — to the best of their ability — though they may just be an artifact removed during preprocessing.
Source: Eye Movements
Explanation: “Eye movements are a result of the strong dipole inside the eye. When the eyes are stationary, this dipole creates a static voltage gradient across the scalp, which is removed by baseline correction and high-pass filters. When the eyes move, the voltages becomes more positive over the side of the head that they eyes now point toward “ (Luck, 2014, pg. 198)
Additional explanation: lateral eye movements
Solution: If eye movements are believed to contaminate your data, using a central fixation point (and instructing participants to keep their vision focused upon it) is one solution. Further, the characteristic shape of “real eye movevements” (a “boxcar-shaped voltage deflection” resulting from “subjects mak[ing] a saccade from the fixation point to some other location and then … another saccade to return to the fixation point”) helps in making it distinct from noise, improving pre-processing ease (Luck, 2014, pg. 198-9).
Source: EMG signals
Explanation: “The temporalis muscles are powerful muscles that we use to contract our jaws, and they are located right under the T7 and T8 electrodes [see figure 2 below]. If you see a lot of EMG in this region of the head, you can ask the subject to relax his or her jaw and avoid teeth-clenching. The temporalis muscles are so large, however, that you will see small but consistent highfrequency EMG artifact at T7 and T8 throughout the session in some subjects, even when they try to relax.” (Luck, 2014, pg. 205)
“The muscles of the neck are the remaining common source of EMG noise. If a mastoid reference is used, this activity may be picked up by the reference electrode and therefore appears in all channels that use this reference. If a different reference site is used, EMG noise arising from the neck appears at the most inferior occipital and temporal electrode sites. It can usually be minimized by asking the subject to sit straight upright rather than leaning the head forward. Neck EMG can also be minimized by having the subject sit back in a recliner with the head leaning against the recliner, but this can cause artifacts in the occipital electrodes.” (Luck, 2014, pg. 206)
Additionally, “It turns out that there is a strong electrical gradient between the base of the tongue and the tip of the tongue. Consequently, when the tongue moves up and down in the mouth, it creates large voltages that propagate to the surface of the head. These voltages are called glossokinetic artifacts” (Luck, 2014, pg. 207)
Additional explanation: chewing and hypoglossal movement, muscle
Solution: Instruct participants to remain as still as possible, reacting only in ways that align with their specific task response. Additionally, try to avoid trials that necessitate head movements, verbal responses, or any sort of movement beyond a stationary position. “[Neck muscles] can usually be minimized by asking the subject to sit straight upright rather than leaning the head forward. [They] can also be minimized by having the subject sit back in a recliner with the head leaning against the recliner, but this can cause artifacts in the occipital electrodes” (Luck, 2014, pg. 206). “When such [movement] tasks can not be avoided, one should try to plan the experiment so that the periods of movement do not overlap with critical periods of data collection.”$^{9}$ Of course, if your project necessitates movement of some kind (e.g., looking between different screens, etc.) attempt to limit it as much as is feasible (i.e. eye movement instead of head movement). Otherwise, if the project truly necessitates a large movement, plan accordingly for the applicable noise.
IMPORTANT TIP: Incidental movements are almost a given. Record timestamps of these movements, as this will better facilitate the preprocessing phase if you are able to quickly locate EMG signals.
Source: Fatigue
Explanation: Participants may grow fatigued from a long trial length or repeat exposure to repeat stimuli. This can be an issue two-fold: their response to the stimulus may decrease as their mind wanders and they grow fidgety and restless, increasing noise.
Solution: Keep recording sessions on the shorter side. Additionally, it is recommended to give participants breaks in between trials.
Source: Electrode or Cable movement
Explanation: “Cable sway in non-wireless systems … causes artifacts. This can be attributed to the motion of the conductor within the magnetic field or to triboelectric noise that is caused by friction of the cable’s components.”$^{5}$
“a movement in the electrodes will sometimes cause the voltage to change suddenly to a new level” (Luck, 2014, page 202)
Solution: Minimize movement of the EEG setup as much as possible. Ensure that wires do not cross over one another during recordings. Much like EMG signals, cable sway can be minimized by keep participants as stationary as possible within the confines of the experimental procedure.
Source: Poor ground connection or reference interference
Explanation: “a poor ground connection … should be the first thing checked whenever trouble shooting noise problems. ... Common causes of a floating ground can be a broken ground wire, the wire coming loose from the grounding site …, using a ground site too far from the recording, a broken wire/pin on the electrode or headstage, or a malfunctioning headstage.”$^{6}$
Note: “You can never record the voltage at a single scalp electrode. Rather, the EEG is always recorded as a potential for current to pass through one electrode (called the active electrode) to some other specific place. This “other specific place” is usually a ground electrode” (Luck, 2014, pg. 150)
Solution: Check the recording equipment for any noticeable issues.
Source: Reference interference
Explanation: “Avoid using a reference that introduces a lot of noise into your data (a reference electrode near the temporalis muscle will pick up a lot of muscle-related activity… [which] will then be present in all channels that use this reference”. Additionally, “any noise in the reference electrode will be present in all electrodes that use this reference ... Thus, if you see some noise in all the channels that share a particular reference site, then the noise is almost certainly coming from the reference site.” (Luck, 2014, pg. 162)
Solution: In picking a reference, consult the literature to establish a conventional reference away from potential confounding noise.
Source: Overheating equipment
(Not quite as prevalent, though still something to keep in mind!)
Explanation: “In the unlikely event that you are able to eliminate all other sources of noise, your signal will still have thermal noise. This is caused by Brownian motion in conductors or semiconductors in the entire signal path before the signal is digitized (including the electrode itself), and since Brownian motion is independent in every location, it cannot be removed or reduced by a reference. Luckily though thermal noise is unlikely to drastically interfere with the electrophysiological signal as long as none of your devices are overheating.”
Solution: “Make sure that electronics are properly ventilated and kept in a cool environment.”$^{6}$ Additionally, recording in a cool place means that there is less sweat and skin potentials, so less noise overall!
Event Codes and Epoching
By Grace Lim for Neurotech@Davis
Event Codes
As you may know, the most important property of EEG comes from its temporal resolution. This is why the creation of event codes, an integer that indicates the type of event that occurred during data collection and the time it happened, is crucial. The actual number that denotes an event is arbitrary, but it is important that you use a different integer for each event. Some examples of events you might want to create a code for are: the onset of your target stimulus or the onset of the participant’s response. The reason event codes are important is to create epochs and makes it possible to analyze how brain activity is related to particular stimuli or actions.
| Event | Description | Event Code |
|---|---|---|
| Valid Target | A correctly identified target stimulus | 100 |
| Invalid Target | An incorrectly identified target | 101 |
| Non-Target | A non-target stimulus | 200 |
| Correct Response | Participant responds correctly | 300 |
| Incorrect Response | Participant responds incorrectly | 301 |
| No Response | Participant fails to respond | 400 |
This table here I just created from ChatGPT to show a simple event code table for a hypothetical experiment. You can see here how related events have similar event codes, which is just a stylistic choice.
Whoever is programming the stimuli can create a script to send these event codes to the EEG recording system. These event codes will pop up in real time as you run your experiment, so you can use this information for analysis.
For more information on event codes, please visit here or the ERPLAB wiki page
Epoching
Epoching is the process of converting the continuous EEG to time-locked segments that correspond to your events. This is interrelated to event codes because you use your event codes to create epochs surrounding them. For example, an epoch might start 200 milliseconds before the stimulus and end 800 milliseconds after it. These epochs are then averaged into bins, so we can identify patterns in our neural data in response to events. Bins are just containers of epochs that are using the same event, this is arbitrary as one can make these conditions very specific. Different experimental conditions (e.g., valid vs. invalid targets) generate separate sets of epochs, allowing comparisons of brain activity across different types of stimuli or responses. Epochs are typically used in ERP experiments because of the nature of averaging ERPs found across trials or bins. However, as you read more on different types of EEG experiments you will find how crucial event codes and epoching are.
For more information on epoching, in the more practical sense, please visit the ERPLAB wiki page. If you are not using EEGLAB in MATLAB I recommend researching the documentation for a Python based library.
Additionl Considerations
By Sofia Fischel for Neurotech@Davis
SOA
Stimulus-onset asynchrony, or SOA, is the length of time between the onset of one stimulus and the next.
Determining the specific length of SOAs requires a certain threading of the needle. If the interval between stimuli is too long, subjects may grow fidgety, increasing EMG noise. In the context of ERP experiments, at “short SOAs, the brain will still be busy processing the first target when the second target appears, and this delays the response to the second target” (Luck). Note: a component that is highly refractory will, when “a stimulus at a particular location is preceded by another stimulus at the same location at a short delay,” produce a greatly reduced response to the second stimulus reduced” (Luck). Investigate the refraction period of the component, if applicable, and plan the SOA length accordingly. It is best to keep SOAs consistent across potential conditions, as a “degree of anticipation” may “confound the results” (Luck) if it varies across trial blocks.
For a more in depth explanation of this trade off, read page 144-5 from Luck, 2014.
You will usually want to choose a stimulus duration that avoids offset responses, either by choosing a duration that is so short that it doesn’t produce a substantial offset response (e.g., 100 – 200 ms for visual stimuli) or is so long that the offset response occurs after the ERP components of interest (e.g., 1000 ms). In behavioral experiments, it is common for the stimulus to offset when the subject makes a behavioral response to the stimulus. … My typical approach for experiments with simple visual stimuli is to use a duration of 100 ms for college student subjects … For simple auditory tones, I would typically use a duration of 50 – 100 ms, including 5-ms rise and fall times. For experiments with more complex auditory or visual stimuli, I typically use a duration of 750 – 1000 ms.
Determining the optimal amount of time between trials requires balancing several factors. On the one hand, you want to keep the amount of time between trials as short as possible to get the maximal number of trials in your experimental session, thereby maximizing the signal-to-noise ratio of your average ERP waveforms. On the other hand, several factors favor a slower rate of stimulus presentation. First, sensory components tend to get smaller as the SOA and ISI decrease, and this reduction in signal might outweigh the reduction in noise that you would get by averaging more trials together. Second, if the subject is required to make a response on each trial, it becomes tiring to do the task if the interval between successive trials is very short. Third, a short SOA will tend to increase the amount of overlapping ERP activity (which may or may not be a problem, as described earlier). However, using a very long interval between stimuli to minimize overlap may lead to a different problem; namely, anticipatory brain activity prior to stimulus onset (especially if stimulus onset time is relatively predictable). My typical approach is to use an SOA of 1500 ms for experiments in which each trial consists of a single stimulus presentation and the subject must respond on each trial (e.g., an oddball experiment). I typically reduce this to 1000 ms if the subject responds on only a small proportion of trials, and I might increase it by a few hundred milliseconds for more difficult tasks or for groups of subjects who respond slowly. Of course, there are times when the conceptual goals of the experiment require a different set of timing parameters, but I find that this kind of timing is optimal for most relatively simple ERP experiments.
Stimuli
Stimuli Habituation
“Given that a particular stimulus elicits a response, repeated applications of the stimulus result in decreased response (habituation). The decrease is usually a negative exponential function of the number of stimulus presentations … Other things being equal, the more rapid the frequency of stimulation, the more rapid and/or more pronounced is habituation … The effect occurs in terms of real time course and occurs within certain limits in terms of number of trials as well. [However,] if the stimulus is withheld, the response tends to recover over time (spontaneous recovery).”$^{7}$ Allowing for participant breaks and a longer ITI can allow for this response recovery, though the exact timing will require more precise literature review depending on project type.
If you are attempting to elicit strong emotional responses to a stimulus (fear, anger, etc.), be forewarned that responses are quick to habituate, particularly in a controlled experiment (Luck) and it may be difficult to collect enough data across a participant as their initial reaction diminishes due to repeat exposure.
Sensory Confounds
Hillyard principle: “responses should be compared to the same physical stimuli while holding overall arousal level and task demands constant, such that all that differs is the focus of selective attention.”$^{8}$ Rephrased: “To avoid sensory confounds, you must compare ERPs elicited by exactly the same physical stimuli, varying only the psychological conditions.” (Luck, 2014, pg. 134)
Imagine an experiment in which “the target is the letter X, and the nontarget is the letter O. X is presented on 20% of trials, and O is presented on the other 80%.” As “the target and nontarget stimuli differ in terms of both shape and probability,”) this experiment is in violation of the Hillyard Principle. You could counterbalance the X’s and O’s (X is the target half the time, and O is the target the other half), though “stimulus-specific adaptation” remains*.* “Specifically, a difference in the probability of occurrence between two stimuli creates differences in sensory adaptation, which will in turn create differences in the sensory response to the two stimuli. The basic idea is that when the visual system encounters a particular stimulus many times, the neurons that code that stimulus will produce smaller and smaller responses. This is known as stimulus-specific adaptation or refractoriness .” “Instead of using X and O as the stimuli, we could use the letters A, B, C, D, and E. Each of these letters would occur on 20% of trials. We would then have five different trial blocks, with a different letter designated as the target in each block (e.g., in one block, we would say that D is the target and all of the other letters were nontargets). We could then present exactly the same sequence of stimuli in each trial block, with the target category (e.g., D) occurring on 20% of trials and the nontarget category (e.g., A, B, C, and E) occurring on the remaining 80%. This would solve the sensory adaptation problem, because the probability of any given physical stimulus is 20%, whether it is the target stimulus or a nontarget stimulus” (Luck, 2014, pg. 131-134).
Note: In this specific experiment, we would vary the order of the letters within trials! Just because we keep the stimuli presentation the same does not mean the ordering must remain fixed. If anything, participants learning, implicitly or explicitly, aspects of the design when there is some element of “surprise” (and it is not the express purpose of the experiment for them to do so) can lead to inconsistent results.
General Note: “Large changes in brightness” from a monitor can “lead to event locked spikes in noise.”$^{9}$. In general, keep the recording setup and environment as consistent as possible across all trials and participants.
Creation of Stimuli
PsychoPy is a fantastic resource for stimuli creation; use this resource for an indepth explanation and setup help.
Data analysis
Though this section of the wiki is dedicated to experimental design, with more in depth coverage of data processing to come, it would be remiss to exclude a brief discussion on data analysis now. It is a dangerous game to work on various stages of the project pipeline in isolation from one another: disregarding additional research once data collection has begun, ignoring a review of the data until all participants have been recorded. Instead, it is better practice to complete some preprocessing or rudimentary analysis after you have collected data from a participant or two. Ensure that the board has been set up with the pins in their correct placement, the proper channels in their right place. Ensure there is no obvious noise artifact in the recording environment that may be removed before the next collection period. If you need to make tweaks, it’s better to do so before you have fully invested time in recording data from a large group of participants, or invested several hours into a setup that, after a quick scan of the data, would prove unusable.
Remember: “data that are consistently noisy or have systematic artifacts are not likely to be much improved by artifact rejection” (-Jon Hansen of Hansen’s axiom)
Even More Tips
The following is taken directly from Luck, 2014, page 144**.** Though they include specific tips referencing ERP experiments, they may still be broadly applicable across all project types. Despite a difference in evaluating particular components, the fundamentals of experimental design remain.
Tip 1 Whenever possible, avoid physical stimulus confounds by using the same physical stimuli across different psychological conditions (i.e., follow the Hillyard principle). This includes “context” confounds, such as differences in sequential order. Difference waves can sometimes be used to subtract away the sensory response, making it possible to compare conditions with physically different stimuli.
Tip 2 When physical stimulus confounds cannot be avoided, conduct control experiments to assess their plausibility. Don’t assume that a small physical stimulus difference cannot explain an ERP effect, especially when the latency of the effect is less than 300 ms.
Tip 3 Although it is often valid to compare averaged ERPs that are based on different numbers of trials, be careful in such situations and avoid using peak-based measures.
Tip 4 Avoid comparing conditions that differ in the presence or timing of motor responses. This can be achieved by requiring responses for all trial types or by comparing subsets of trials with equivalent responses.
Tip 5 To prevent confounds related to differences in arousal and preparatory activity, experimental conditions should be varied within trial blocks rather than between trial blocks. When conditions must be varied between blocks, arousal confounds can be prevented by equating task difficulty across conditions.
Tip 6 Think carefully about stimulus timing so that you don’t contaminate your data with offset responses or overlapping activity from the previous trial.
Literature Review
By Sofia Fischel for Neurotech@Davis
The abstraction pieces and definitions of the previous section are vital information to understand before planning a recording session, though forming the whole puzzle takes them a step further. It is somewhat difficult to fully encapsulate the intermediate step between the two: there is more nuance and minutiae than is able to be neatly summarized in one section, and a great deal of specificity is lost when staying in the realm of the general, as these sections have mainly focused. It is difficult too to forewarn of every potential issue teams may face when project types vary widely (monitoring ERP signals vs alpha waves, for example). As a result, it is imperative that a detailed literature review occurs. There’s no need to reinvent the wheel. Particularly with long established EEG paradigms – P300, N400, etc. – there are countless studies that can provide excellent resources; note common themes in electrode placement, stimulus, type, trial length, etc. Other UC neurotech clubs are often useful resources for the notable reason of using the same equipment (OpenBCI Cyton boards). Research studies too are important in finding the information above, though they often have more advanced technology at their disposal, so note if they are using EEG caps, EMG monitors, etc. It may be required to accommodate accordingly.
Spend a substantial amount of time doing research; much like good experimental design, investing time now saves effort down the road.
Example
Read through the following taken from the following paper: “EEG Correlates of Involuntary Cognitions in the Reflexive Imagery Task”$^{10}$. Notice the level of specificity. (Click Figure 1 for the schematic description of the trial sequence and Appendix for the stimuli).
This is the level of detail to strive for during project proposals. Remember: imagine someone is given only your experimental design and is tasked with running the setup exactly as you have imagined; are they given enough detail to do so? Where might there be some confusion?
Abstract of study: “The Reflexive Imagery Task (RIT) reveals that the activation of sets can result in involuntary cognitions that are triggered by external stimuli. In the basic RIT, subjects are presented with an image of an object (e.g., CAT) and instructed to not think of the name of the object. Involuntary subvocalizations of the name (the RIT effect) arise on roughly 80% of the trials. We conducted an electroencephalography (EEG) study to explore the neural correlates of the RIT effect. Subjects were presented with one object at a time in one condition and two objects simultaneously in another condition. Five regions were defined by electrode sites: frontal (F3–F4), parietal (P3–P4), temporal (T3–T4), right hemisphere (F4–P4), and left hemisphere (F3–P3). We focused on the alpha (8–13 Hz), beta (13–30 Hz), delta (0.01–4 Hz), and theta (4–8 Hz) frequencies.”
Instructions were presented on a 56 cm monitor using a Dell Optiplex 980 computer with a viewing distance of approximately 60 cm. Stimulus presentation and behavioral data were controlled by SuperLab version 5 (Cedrus Corporation) software. Instructions were presented in black 48-point Helvetica font on a light gray background. In the One-Object block, the stimuli consisted of 37 well-known visual objects (e.g., a key; Figure 1; Appendix) that were displayed at a centered viewing angle of 4.22°× 6.49° (4.42 cm × 6.80 cm). In the Two-Object block, the stimuli consisted of 72 visual objects (e.g., a fire and a cake; Appendix) that were not part of the stimulus set in the One-Object block. On each trial, two visual objects were presented side by side with a fixation-cross (+) between the visual objects (Figure 1). The array of stimuli, which was composed of both visual objects, was presented on the screen with a subtended visual angle of 17.76°× 5.96° (15 cm × 5 cm). Each object occupied the visual angle of 6.56°× 5.96° (5.5 cm × 5 cm). All the stimuli were used successfully in previous research
Procedures
Subjects were run individually, with the experimenter present, in a sound attenuated and electrically shielded room. The experimenter read all instructions aloud to the subject and verified that the subject understood the instructions before proceeding to the critical trials. Before each block, the subject completed a practice trial that resembled the critical trials. Importantly, the stimuli (HARP, for the One-Object block, and FORK and UMBRELLA, for the Two-Object block) to which the subject responded in the practice trials were not included in any of the critical trials. For the purposes of EEG recording, prior to receiving instructions for the critical trials in each block, the subject completed a baseline trial in which he or she gazed at a fixation-cross presented for 1 min.
The funneled debriefing included general questions to assess whether (a) the subject was aware of the purpose of the study, (b) the subject had any strategies for completing the task, (c) anything interfered with his or her performance on the task, (d) there were any objects of which the subject did not know the name, (e) the subject often named both objects during trials in which he or she happened to think of the name of either object, (f) the subject ever thought of the name of the object in a language other than English, (g) he or she pressed the spacebar or “z” key and “/” key in such a situation, and (h) he or she had a strategy for completing the task if he or she happened to think of the name of the object in more than one language. From 25 subjects, the data from all subjects were included in the analysis.
Citations
- Front-matter. (2017). Designing EEG Experiments for Studying the Brain, i–iii. https://doi.org/10.1016/b978-0-12-811140-6.00015-1
- Steffensen, S. C., Ohran, A. J., Shipp, D. N., Hales, K., Stobbs, S. H., & Fleming, D. E. (2008). Gender-selective effects of the P300 and N400 components of the visual evoked potential. Vision Research, 48(7), 917–925. https://doi.org/10.1016/j.visres.2008.01.005
- Luck, S. J. (2022). Applied Event-Related Potential Data Analysis. LibreTexts. https://doi.org/10.18115/D5QG92
- Luck, Steven J. An introduction to the event-related potential technique. MIT press, 2014.
- Symeonidou, E.-R., Nordin, A. D., Hairston, W. D., & Ferris, D. P. (2018, April 3). Effects of cable sway, electrode surface area, and electrode mass on electroencephalography signal quality during motion. Sensors (Basel, Switzerland). https://www.ncbi.nlm.nih.gov/pmc/articles/PMC5948545/
- Causes of noise in Electrophysiological Recordings. Plexon. (2024, August 8). https://plexon.com/blog-post/causes-of-noise-in-electrophysiological-recordings/
- Thompson R. F. (2009). Habituation: a history. Neurobiology of learning and memory, 92(2), 127–134. https://doi.org/10.1016/j.nlm.2008.07.011
- Stevens, C., & Bavelier, D. (2011). The role of selective attention on academic foundations: A cognitive neuroscience perspective. Developmental Cognitive Neuroscience, 2, S30–S48. https://doi.org/10.1016/j.dcn.2011.11.001
- Grega, G. (2010). Dealing with Noise in EEG Recording and Data Analysis . Informatica Medica Slovenica.
- Dou, W., Allen, A. K., Cho, H., Bhangal, S., Cook, A. J., Morsella, E., & Geisler, M. W. (2020). EEG Correlates of Involuntary Cognitions in the Reflexive Imagery Task. Frontiers in psychology, 11, 482. https://doi.org/10.3389/fpsyg.2020.00482
EEG Data Processing
By Avni Bafna for Neurotech@Davis
Electroencephalography (EEG) is a powerful tool for measuring the brain's electrical activity, capturing real-time data on neural oscillations and cognitive processes. However, raw EEG signals are complex, noisy, and require extensive processing to extract meaningful insights. EEG data processing involves multiple steps, including filtering, artifact removal, feature extraction, and signal classification, to decode patterns of brain activity. Whether used in neuroscience research, brain-computer interfaces (BCIs), or clinical diagnostics, effective EEG data processing is essential for translating electrical brain signals into actionable information for understanding and interacting with the brain.
What to do after collecting data?
By Avni Bafna for Neurotech@Davis
After collecting EEG (electroencephalography) data in a neurotech project, there are several important steps you can take to process, analyze, and interpret the data effectively. These steps are:
- Preprocessing the raw data
- Feature Extraction
- Classification
Why is signal processing necessary?
- Noise Reduction and Artifact Removal: EEG signals are often contaminated with various types of noise, including muscle activity, eye blinks, electrical interference, and environmental noise. Signal processing techniques help to remove or reduce these artifacts, allowing researchers to focus on the brain's electrical activity of interest.
- Enhancing Signal-to-Noise Ratio: EEG signals are relatively weak compared to the background noise. Signal processing methods can amplify the relevant brain signals while suppressing unwanted noise, thus improving the overall signal-to-noise ratio.
- Feature Extraction: Signal processing allows researchers to extract meaningful features from EEG data that correspond to specific brain activities. These features can include frequency components, amplitude variations, and temporal patterns that provide insights into cognitive processes, mental states, and neurological conditions.
- Frequency and Time-Frequency Analysis: Processing allows for the analysis of frequency components and changes over time. Brain activity is often associated with specific frequency bands, and time-frequency analysis helps identify when and where these frequency changes occur during different tasks or conditions.
- Classification and Pattern Recognition: Processed EEG data can be used to train machine learning models for classification tasks. These models can differentiate between different cognitive states, emotions, or clinical conditions based on patterns present in the data.
What is Data Preprocessing?
Preprocessing refers to the procedure of removing noise and enhancing the signal of interest from the raw EEG data in order to get clean signals closer to the true neural activity. This helps transform raw data into a format that is suitable for analysis and extracting meaningful insights.
Why is Preprocessing Needed?
- Signals picked up from the scalp are not an accurate representation of signals originating from the brain due to loss of spatial information.
- EEG data is very noisy as artifacts such as eye movements, cardiac activity, or muscle movements can distort the data which can obscure weaker EEG signals.
- It helps separate relevant neural activity from the random neural activity that occurs during EEG data recordings.
How does Preprocessing differ based on the analysis?
Before beginning to preprocess the data, it is important to choose an appropriate method of preprocessing. Some relevant questions to keep in mind while preprocessing data are:
- What features of the EEG signal do you want to focus on? If you are planning on analyzing whether the brain is in a relaxed state, you would analyze the alpha waves between 8-12Hz.
- What artifacts are present in the data? Which artifacts would you want to remove and which do you want to be aware of? Artifacts like jaw clenches, eye movements, and muscle movements might be considered noise in some circumstances but could be helpful in revealing important patterns.
Libraries used for Preprocessing:
- MNE (Magnetoencephalography and Electroencephalography) is an open-source Python library focused on processing and analyzing EEG and MEG data, offering tools for data preprocessing, visualization, source localization, and statistical analysis.
- Brainflow is an open-source library that provides a unified API for working with various EEG, EMG, and ECG devices, enabling developers to interact with neurophysiological data using a consistent interface.
Setting-Up the Environment
By Avni Bafna for Neurotech@Davis
Before starting preprocessing import and install the dependencies.
import pandas as pd
import numpy as np
!pip install mne
import mne
Load the raw data and plot the data file
- Import the raw EEG data from the recording equipment (OpenBCI data file) into your analysis software (Jupyter notebook) and plot the data.
- Verify that the sampling rate is appropriate for your analysis. Common EEG sampling rates are 250 Hz or 500 Hz.
# Load CSV data using pandas
csv_file_path = '/content/drive/MyDrive/Sample/BrainFlow-RAW.csv'

# Load data from CSV into an array
trial_data = np.genfromtxt(csv_file_path)

# Declares channel names and types of each set of data
sfreq = 250  # sample rate in Hz
ch_names = ['Channel {}'.format(i) for i in range(trial_data.shape[1])]
ch_types = ['eeg' for i in range(trial_data.shape[1])]

# Create info structures and RawArray objects for each set of data
info = mne.create_info(ch_names=ch_names, sfreq=sfreq, ch_types=ch_types)
raw = mne.io.RawArray(trial_data.T, info)

# Removing irrelevant channels
ch_names = [raw.ch_names]
ch_names_to_keep = [ch_names[0][1:9]]
raw = raw.pick_channels(ch_names_to_keep[0])

# Now you can work with the MNE Raw object
print(raw.info)
print(raw.get_data())

# Plot the specified interval
raw.plot(duration=200, scalings='auto')
Filtering
It is common to filter certain frequencies so that we can enhance the frequencies of interest.
High-Pass Filter:
- A high-pass filter attenuates frequencies below a certain cutoff frequency and allows higher frequencies to pass through.
- In EEG preprocessing, a high-pass filter is used to remove slow variations, DC offsets, and other low-frequency artifacts, such as electrode drift or baseline shifts.
- Common cutoff frequencies for high-pass filters in EEG data preprocessing are around 0.5 Hz.
# Apply a high-pass filter with a cutoff frequency of 3 Hz
raw.filter(l_freq=3, h_freq=None)
raw.plot(duration=200, scalings='auto')
Low-Pass Filter:
- A low-pass filter attenuates frequencies above a certain cutoff frequency and allows lower frequencies to pass through.
- In EEG preprocessing, a low-pass filter helps remove high-frequency noise, muscle artifacts, and high-frequency components that are not relevant to the analysis.
- Common cutoff frequencies for low-pass filters in EEG data preprocessing are typically around 40 Hz.
# Apply a low-pass filter with a cutoff frequency of 40 Hz
raw.filter(l_freq=None, h_freq=40)
raw.plot(duration=200, scalings='auto')
Band-Pass Filter:
- A band-pass filter allows a specific range of frequencies, defined by a lower cutoff frequency and an upper cutoff frequency, to pass through while attenuating frequencies outside this range.
- In EEG analysis, a band-pass filter is often used to isolate frequency bands of interest, such as alpha (8-13 Hz), beta (13-30 Hz), or gamma (30-100 Hz), which are associated with different cognitive processes.
- Band-pass filters are useful for extracting features and patterns specific to certain frequency ranges.
# Apply a bandpass filter with cutoff frequencies of Alpha waves between 8 Hz (low) and 13 Hz (high)
raw.filter(l_freq=8, h_freq=13)
raw.plot(duration=200, scalings='auto')
Notch Filter (Band-Cut Filter):
- A notch filter, also known as a band-cut filter that removes a single frequency.
- Notch filters are used to remove specific sources of interference, such as power line noise (50 or 60 Hz) and their harmonics, which can contaminate EEG signals.
- Notch filters help eliminate periodic noise sources that might be present due to electrical interference.
# Apply a notch filter to remove 60 Hz line noise
raw.notch_filter(60)
raw.plot_psd(fmin=2, fmax=80);
Artifact Removal and Correction
Artifacts can distort the EEG signal and interfere with accurate analysis and interpretation. There are various types of artifacts, including eye blinks, muscle movements, electrode noise, and external interference.
Artifact Detection:
- Automatic Detection: Automated algorithms, such as independent component analysis (ICA), wavelet decomposition, or template matching, can identify components or segments that deviate significantly from the expected EEG patterns. These algorithms often require training data or templates to differentiate artifacts from brain activity.
- Manual Detection: Visual inspection by experts involves reviewing EEG data to identify visually apparent artifacts, such as sharp spikes, slow drifts, or sudden jumps in signal amplitude.
Artifact Removal:
- Independent Component Analysis (ICA): ICA is a widely used method that separates EEG data into independent components, some of which might represent artifacts. By manipulating these components, unwanted artifacts can be removed or minimized while preserving genuine brain-related components.
from mne.preprocessing import ICA
num_components = 6 #play around with this number to get components that seem to represent the actual brain activations well
ica = ICA(n_components=num_components, method='fastica')
ica.fit(raw)

raw.plot(scalings='auto')
- Regression-Based Methods: Regression techniques can be used to model and remove artifacts by regressing out the artifact's contribution from the EEG signal. For instance, electrooculogram (EOG) channels can be used to regress out eye movement artifacts.
- Interpolation: If an entire electrode or channel is affected by an artifact, interpolation techniques can be employed to estimate and replace the missing or distorted data based on neighboring electrodes.
Specialized Techniques:
- Muscle Artifact Removal: Muscle artifacts can be removed by incorporating electromyogram (EMG) recordings or by applying high-pass filters to suppress low-frequency muscle activity.
- Eye Blink Artifact Removal: Eye blink artifacts can be detected and corrected using EOG channels. These artifacts can be identified by the characteristic shape of EOG signals during eye movements.
Removing bad channels
EEG data might contain ‘bad’ channels that do not provide accurate information and it is important to remove them from the analysis. A channel might be excluded if:
- The electrode was placed improperly or had poor contact with the scalp.
- The channel malfunctioned.
By visualizing the raw data, we can identify ‘bad’ channels that have no signal or look noisier than other channels. After identifying the bad channels, we can exclude them from the analysis by creating a subset of channels marked as ‘bad’. An optional step would be to interpolate (fill in the missing data) by using the activity of surrounding channels to make an educated guess of activity at the bad channel.
# Mark channels as bad
bad_channels = ['Channel 2', 'Channel 6']  # List of channel names to mark as bad
raw.info['bads'] = bad_channels

# Remove bad channels from further analysis
raw.pick_types(eeg=True, exclude='bads')

# Plot the cleaned EEG data
raw.plot(scalings='auto')
Downsampling (optional)
Downsampling is the process of reducing the sampling rate of a signal by selecting and keeping only a subset of the original samples. This is typically done to reduce computational load, storage requirements, and to focus on specific frequency components of interest. Downsampling can also result in loss of high-frequency information and introduce aliasing effects if not performed carefully with appropriate anti-aliasing filters.
3.6 Re-referencing (optional)
Re-reference the data to a common point of reference if it was initially referenced to individual electrodes. References should be located as far away from the signal of interest (ie. Mastoid, earlobe)
What is epoching?
By Avni Bafna for Neurotech@Davis
Epoching involves dividing continuous EEG data into smaller segments known as "epochs." Each epoch corresponds to a specific time interval of interest within the EEG recording. Epoching is a fundamental step that enables researchers to analyze brain activity in response to events, stimuli, or conditions.
Approaches to Epoching
- Time-Based Epoching: In time-based epoching, EEG data is divided into fixed time intervals, regardless of specific events or stimuli. Epochs are created by splitting the continuous EEG signal into equal-duration segments, often referred to as "time windows." This approach is useful when you're interested in studying general patterns of brain activity over time, without focusing on specific events or stimuli. Time-based epoching can help capture long-term trends, such as changes in brain activity during different phases of a task or recording session.
- Stimulation-Based Epoching: In simulation-based epoching, EEG data is segmented based on specific events or stimuli of interest. Epochs are defined around event markers that represent the occurrence of stimuli, tasks, or conditions. Each epoch captures the brain's response to a particular event, allowing researchers to analyze the neural processes associated with those events. Stimulation-based epoching is commonly used in event-related potential (ERP) studies, where researchers are interested in characterizing the brain's response to specific sensory, cognitive, or motor events.
What is feature extraction?
By Avni Bafna for Neurotech@Davis
Feature extraction is a process in which meaningful and informative attributes or features are derived from raw data. In the context of EEG (electroencephalography) data analysis, feature extraction involves transforming the complex EEG signal into a set of representative features that capture essential characteristics of brain activity. These extracted features serve as inputs for further analysis, classification, and interpretation.
Why is feature extraction important?
- Dimensionality Reduction: EEG data can consist of hundreds or thousands of data points (channels) collected over time. Extracting relevant features condenses this high-dimensional data into a smaller set of informative attributes, reducing computational complexity and memory requirements.
- Information Compression: Feature extraction condenses raw EEG signals into meaningful representations that capture essential characteristics of brain activity. This compression retains important information while discarding noise and irrelevant details.
- Machine Learning: Many machine learning algorithms work better with lower-dimensional feature sets. Well-chosen features can improve the performance of algorithms by providing them with more relevant information.
- Statistical Significance: Extracted features can be used as input to statistical tests, making it easier to analyze and compare data between different conditions or groups. Depending on the research question, you can tailor feature extraction to focus on specific aspects of the EEG data, such as frequency content, temporal patterns, or connectivity.
Methods of feature extraction
- Manual Feature Extraction: Manual feature extraction involves selecting and computing features from data based on domain knowledge and expertise. Researchers identify relevant attributes by understanding the underlying phenomena and selecting features that are informative for the analysis. This approach requires a deep understanding of the data and its context, as well as expertise in signal processing and neuroscience. Manual feature extraction can lead to highly interpretable and domain-specific features, but it can be time-consuming and might not capture all subtle patterns in complex data.
- Automatic Feature Extraction: Automatic feature extraction employs algorithms to automatically identify relevant features from raw data. These algorithms learn from the data itself and capture patterns that might not be immediately apparent to humans. Techniques such as deep learning, wavelet transforms, and principal component analysis (PCA) are used to extract features without manual intervention. Automatic methods can efficiently handle high-dimensional data, uncover intricate patterns, and be more robust to noise. However, they might produce features that are less interpretable than those obtained through manual extraction.
Event Related Potential
Event-related potentials (ERPs) are small, rapid fluctuations in the electroencephalogram (EEG) signal that occur in response to specific sensory, cognitive, or motor events. ERPs are time-locked to the onset of these events and provide valuable insights into the brain's neural processing of different stimuli or conditions. ERPs are widely used in neuroscience, cognitive psychology, and clinical research to study the timing, amplitude, and topography of brain responses to various stimuli or tasks. Some examples of ERPs are:
- P300 (Oddball Paradigm): In an oddball paradigm, participants are presented with a series of stimuli, most of which are common (frequent), and some are rare (infrequent or deviant). The P300 ERP is a positive deflection in the EEG waveform that occurs around 300 milliseconds after the presentation of a rare or target stimulus. P300 is associated with attention, cognitive processing, and the detection of significant or unexpected events.
- N170 (Face Recognition): The N170 ERP is a negative deflection occurring around 170 milliseconds after the presentation of faces or other visually complex stimuli. N170 is particularly pronounced when participants are presented with faces compared to other object categories. It reflects early visual processing and is often associated with face perception and recognition.
- Mismatch Negativity (MMN): MMN is a negative ERP component that occurs when participants are presented with an unexpected or deviant stimulus in a sequence of standard stimuli. It appears around 100-250 milliseconds after the presentation of the deviant stimulus. MMN is related to the brain's automatic detection and processing of auditory changes and can be used to study sensory memory and cognitive processes.
- N400 (Language Processing): The N400 ERP is a negative deflection occurring around 400 milliseconds after the presentation of a semantically incongruent word or phrase within a sentence. It reflects semantic processing and is sensitive to violations in the meaning or context of language.
- Contingent Negative Variation (CNV): CNV is a slow, negative-going potential that emerges during the anticipation of an upcoming event or stimulus. It is often used in studies involving temporal expectations and preparation for motor responses.
- Error-Related Negativity (ERN): ERN is a negative deflection that occurs shortly after an individual makes an error during a cognitive task. It is thought to reflect the brain's detection of errors and is associated with conflict monitoring and response inhibition.
5.5 Feature Extraction Techniques
- Principal component analysis, or PCA, is a dimensionality-reduction method that is often used to reduce the dimensionality of large data sets, by transforming a large set of variables into a smaller one that still contains most of the information in the large set.
- ICA is a statistical procedure that splits a set of mixed signals to its sources without previous information on the nature of the signal. The only assumption involved in the ICA is that the unknown underlying sources are mutually independent in statistical terms. ICA assumes that the observed EEG signal is a mixture of several independent source signals coming from multiple cognitive activities or artifacts.
- Locally linear embedding (LLE) seeks a lower-dimensional projection of the data which preserves distances within local neighborhoods. It can be thought of as a series of local Principal Component Analyses which are globally compared to find the best non-linear embedding.
- t-SNE ( t-Distributed Stochastic Neighbor Embedding) is a technique that visualizes high dimensional data by giving each point a location in a two or three-dimensional map. The technique is the Stochastic Neighbor Embedding (SNE) variation that is much easier to optimize and produces significantly better visualization.
Fourier Transform
Fourier Transform is a mathematical technique used to analyze and transform a signal from its original time domain representation into its frequency domain representation. In the context of EEG (electroencephalography), the Fourier Transform is used to understand the frequency components present in the EEG signals, revealing information about the underlying neural activity.
- Time Domain to Frequency Domain: EEG signals are originally recorded as a series of voltage measurements over time. The Fourier Transform converts these time-domain EEG signals into a representation that shows how much energy is present at different frequencies.
- Components of Fourier Transform: The Fourier Transform decomposes the EEG signal into a sum of sinusoidal waves (sine and cosine functions) of different frequencies and amplitudes. Each component in the sum represents a specific frequency component within the original EEG signal.
- Frequency Spectrum: The output of the Fourier Transform is a frequency spectrum, which is a plot of frequency on the x-axis and the corresponding magnitude or power of each frequency component on the y-axis. The spectrum shows which frequencies are present in the EEG signal and how strong they are.
- Dominant Frequency Bands: EEG signals typically contain multiple frequency components, which can be categorized into different frequency bands: delta (0.5-4 Hz), theta (4-8 Hz), alpha (8-13 Hz), beta (13-30 Hz), and gamma (30-100 Hz). Analyzing the power distribution across these frequency bands can provide insights into the brain's activity during different cognitive states.
- Power Spectral Density (PSD): The power spectral density is a measure of how the power of each frequency component in the EEG signal is distributed across the frequency spectrum. The PSD provides information about the relative strength of different frequency bands, allowing researchers to identify dominant frequencies and trends in brain activity.
What is a Classifier?
By Avni Bafna for Neurotech@Davis
A classifier is a fundamental component in machine learning that's used to assign labels or categories to input data based on patterns and features present in the data. It's a model that learns from labeled examples in a training dataset and then predicts the labels of new, unseen data. The goal of a classifier is to generalize from the training data to accurately classify unknown instances.
How does a classifier work?
- Training Phase: During the training phase, a classifier is presented with a labeled dataset where each data point is associated with a known category or label. The classifier analyzes the features of the training data and learns to recognize patterns that distinguish different classes.
- Feature Extraction: Features extracted from the data are important inputs for the classifier. These features might be manually selected, automatically derived, or a combination of both.
- Model Building: The classifier builds a model based on the relationships between the features and the corresponding labels in the training data. The model captures the decision boundaries or decision rules that separate different classes in the feature space.
- Prediction Phase: Once the model is trained, it's used to predict the labels of new, unseen data that was not part of the training dataset. The classifier applies the learned decision rules to the feature vectors of the new data to make predictions.
- Evaluation: The accuracy and performance of the classifier are evaluated using various metrics, such as accuracy, precision, recall, F1 score, and confusion matrices. The classifier's ability to generalize to new, unseen data is a key indicator of its effectiveness.
- Classification Output: The output of the classifier is the predicted label or class for each input data point. The classifier assigns a label that it believes is most appropriate based on the patterns it learned during training.
Types of Classifiers
- Decision Trees: Hierarchical tree-like structures that split data based on feature values.
- Random Forests: Ensembles of decision trees that combine their predictions.
- Support Vector Machines (SVM): Creates hyperplanes to separate data points of different classes.
- K-Nearest Neighbors (KNN): Assigns a label to a data point based on the labels of its k-nearest neighbors.
- Naive Bayes: Uses probabilistic models based on Bayes' theorem to predict labels.
- Neural Networks: Complex models that consist of layers of interconnected nodes, known as neurons.
BCI Pipeline
Making cool connections...
By Priyal Patel for Neurotech@Davis
Introduction
What connects all the topics we have covered so far together?
the BCI Pipeline <3
What is a BCI?
A brain computer interface, which means some kind of project that incorporates brain signals in performing a task or predicting a result.
What is a Pipeline?
A way to represent how different components of a project are "connected" together.
How would you link components of a project together?
Using connectors, the special glue. Some modern day examples include bluetooth, usb, wires, electrode gel, python libraries, and so many more.
When researching connectors, two key questions to Google:
- How can [component x] communicate or link with [component y]?
- see how other people have tried to link these components
- What are the limitations of using [connector z]?
- see what problems people have had using this type of connector & their suggestions for alternative connectors
Usually there won't be a direct mention of a "BCI pipeline" in a research paper or open-source project; by the identifying the pipeline steps outline on the next page in these online sources, you can gain ideas for how people went about forming their pipelines.
By Priyal Patel for Neurotech@Davis
Keys Steps in our BCI Pipeline
Big Picture
Steps
- EEG (electroencephalogram) electrodes are placed on the scalp with electrode gel
-
The brain produces continuous electrical signals (analog signals) that are picked up from the scalp by the electrodes
-
These analog signals collected from the electrodes are converted to digital signals (non-continuous & discrete values) by the signal processing hardware
- Using bluetooth communication between the signal processing hardware and a bluetooth usb, the digital signals are passed to the hardware's UI program running
- These digital signals are displayed in by the hardware's UI program revealing wave like patterns
- The amplitude (height of the wave) of each wave measured in microvolts is collected per second and passed as input to the preprocessing program running
-
The preprocessing program applies filters to remove uncharacteristic microvolt values and any additional key changes to the data occur in this step
-
The cleaned data is passed as input to the algorithm or machine learning model to perform a task or predict an outcome
- Finally, the output from the algorithm or machine learning model is printed to display on the laptop: "Person is focused"
- This happens in real-time: each step can be occurring simultaneously as electrical signals are constantly being collected from the scalp
By Priyal Patel for Neurotech@Davis
Adding Hardware
Let's say you want to map the output from the algorithm or machine learning model to make a light flash or make an object move in a certain direction.
So how do you actually do that?
Using hardware ^_^
There are many different ways to accomplish these tasks, but one way we have used in the past is connecting an Arduino to motors, lights, or other pieces of hardware.
How does this work?
1- Create desired input and output mappings
Using a special software language, you can write an instruction set for the arduino to follow that details how to process the input it will receive and what to output. Using a wired usb connection, these instructions are loaded into the Arduino board.
2- Connect output of Arduino board to other hardware
Let's say we are using servo motors. There will be a wire connected to the arduino board to a bigger board and a wire from this board to the servo motor. Servo motors are special because they will rotate a certain amount based on the input received through a wire.
3- Send the output from the computer program to the Arduino board
Using a wired usb connection, the computer can send the output from an algorithm or ML model to the Arduino board. The input will be read and based on the Arduino's instructions a certain position will be sent through a wire to the servo motor.
4- Move an object by rotating the motor
Based on the input received, the servo motor will rotate to this position. There is another wire connected to the motor and another object; this will cause the object to move simultaneously while the motor is rotating.
By Priyal Patel for Neurotech@Davis
Example: Robotic Arm Pipeline
Project Repo
https://github.com/Neurotech-Davis/RoboticArm
Materials
- Emotiv Insight Pro Headset
- Laptop
- Wires
- Breadboard
- Elegoo UNO R3 microcontroller
- 3D Printed Robotic Arm Casing
- Servo Motors
- Batteries
Context
Emotiv has a pre-built mental command detection algorithm. To increase the accuracy of this algorithm for a particular participant, trainings were conducted and using these trainings the algorithm is able to form patterns in brain activity that match each mental command.
Trainings were conducted prior to assist the Emotiv's algorithm in detecting mental commands for our participant Grace Lim (Projects Member 2022-2024, Project's Board Co-Lead 2024-2025).
Node-Red Toolbox Pipeline
How did we create our Pipeline?
1- Key Research Questions
What are the distinct components that we need to connect?
Data collected by the Emotiv headset, Emotiv's mental command detection algorithm, program to map mental commands to arm movement directions, microcontroller, and the robotic arm.
How to feed data collected by the Emotiv headset to Emotiv's mental command detection algorithm?
By examining Emotiv's website, we found two options: using Emotiv's API functions or using the Node-Red Toolbox. We first tried using the API, but needed special authorization information from paid features to access. Then, we pivoted to using the Node-Red Toolbox. The Emotiv website was missing some setup steps, so we leveraged video tutorials on youtube to assist us. After, we tested the software's functionality by mimicing examples we found online and were able to succesfully connect these two components.
How to map mental commands to arm movement directions?
We brainstormed and collectively agreed that the easiest way was to map the name of the command detected to a number; we choose to do this by creating python scripts that use serial connection communication to send the appropriate number to the microcontroller. Node-Red Toolbox enabled us to have a separate node for each command that actived when detected; directly after the related python script node would activate causing this script to run, sending a number to the microcontroller through a wired usb connection.
How to use the input the microcontroller will receive to make the robotic arm move?
A team member with hardware and circuits experience suggested using servo motors to achieve the rotating motion we desired for our robotic arm. We ran into the problem of the arm not being able to rotate enough and added extra batteries to power the motors. Using wired connections and a breadboard, we were able to connect a number for a mental command with a position for the servo motors.
2- Cost Analysis
How much do we want to spend on the project?
As little as possible...found a free online 3D cad design for the arm, used a team member's friend 3D printing to print for cheap, paid for servo motors, paid for batteries, used a team member's microcontroller, used a team member's wiring/breadboard kit, used free software programs, used our Emotiv headset we won at OpenBCI Spring 2023 competition, and picked a project that could hopefully be completed in time for the April 2024 Neurotech Conference competition.
Hardware Setup
Results
When everything connects, exciting things can happen...
Demo of the drop command with participant Grace
Extras
We are so excited to see all the cool ideas and amazing projects built by our fellow Neurotechies!
Machine Learning for Neurotechnology
By Avni Bafna and Priyal Patel for Neurotech@Davis
Neurotechnology, a rapidly evolving field, aims to understand, monitor, and modulate brain function by integrating neuroscience and technology. One of the critical drivers behind this revolution is machine learning (ML), a subset of artificial intelligence (AI) that empowers computers to learn from data, make predictions, and uncover patterns without explicit programming. By applying ML to neurotechnology, researchers can decode brain signals, predict cognitive states, and create advanced brain-computer interfaces (BCIs), leading to breakthroughs in neuroprosthetics, mental health diagnostics, and cognitive enhancements.
In this section, we will explore the role of machine learning in neurotechnology, starting with the basics of machine learning, followed by key techniques like supervised and unsupervised learning, feature extraction, and various ML algorithms used in neurotechnology.
What is Machine Learning?
Click on ->

Machine learning is a computational approach that enables systems to improve their performance on tasks by learning from data. It is especially useful in neurotechnology, where vast amounts of brain-related data are gathered through techniques like electroencephalography (EEG), magnetoencephalography (MEG), and functional MRI (fMRI). These datasets contain patterns that reflect neural activity, which machine learning models can analyze to extract valuable insights.
Supervised vs. Unsupervised Learning
In the realm of machine learning, two primary learning paradigms are widely used: supervised learning and unsupervised learning.
Click on ->

- Supervised Learning: In this approach, the model is trained on labeled data, meaning that each input comes with an associated output (or label). In neurotechnology, supervised learning is used for tasks like classifying brain states (e.g., predicting whether a person is awake or asleep based on EEG data). The algorithm learns to map input features (e.g., brain signals) to the correct labels (e.g., sleep stage) by minimizing prediction errors.
Click on ->

- Unsupervised Learning: Unlike supervised learning, unsupervised learning deals with unlabeled data. The goal here is to uncover hidden patterns or group similar data points together. In neurotechnology, unsupervised learning can be applied to identify clusters of neurons with similar activity patterns or discover new brain states without predefined labels.
Additional Resources
Feature Extraction
Feature extraction is a pivotal step in any machine learning pipeline, especially when working with complex and high-dimensional data like brain signals. In neurotechnology, raw neural data—such as electroencephalogram (EEG) readings, magnetoencephalogram (MEG) signals, and functional MRI (fMRI) scans—contain vast amounts of information, but not all of it is relevant to the specific problem at hand. The goal of feature extraction is to transform these raw signals into a set of meaningful and informative features that can be used by machine learning models.
Feature extraction not only reduces the complexity of the data but also enhances model performance by improving the signal-to-noise ratio. Below are some of the most commonly used techniques in neurotechnology:
1. Time-Domain Features
Time-domain features are derived directly from the temporal aspects of neural signals. They capture important signal characteristics based on their amplitude, duration, and frequency.
- Mean Amplitude: The average signal amplitude over a given time window, often used to represent overall brain activity.
- Signal Variance: Measures the variability in the signal, useful for distinguishing between different brain states.
- Zero Crossing Rate: The rate at which the signal changes its polarity, which can indicate rapid changes in brain activity, such as those during seizures.
In neurotechnology applications, time-domain features are commonly used in real-time EEG analysis for detecting abnormal neural activity (e.g., epileptic seizures).
2. Frequency-Domain Features
Frequency-domain features describe the spectral content of brain signals, which can be especially informative when analyzing oscillatory neural activity like brainwaves.
- Power Spectral Density (PSD): Provides a measure of the power of a signal as a function of its frequency. Different brain states, such as sleep or wakefulness, are associated with specific frequency bands (e.g., delta, theta, alpha, beta, and gamma waves).
- Fourier Transform: Transforms time-domain signals into frequency components, allowing researchers to isolate dominant brain rhythms. For example, alpha waves (8-12 Hz) may dominate when a person is relaxed, while beta waves (13-30 Hz) are more prominent during focused mental tasks.
Frequency-domain features are particularly useful for understanding rhythmic neural activity, which plays a critical role in tasks such as cognitive state classification and sleep stage detection.
3. Wavelet Transform
While Fourier transforms provide useful frequency information, they lack temporal resolution. This is where wavelet transforms come in. Wavelet analysis decomposes a signal into both time and frequency components, allowing for the analysis of non-stationary signals—like brain activity—which vary over time.
- Continuous Wavelet Transform (CWT): Produces a time-frequency representation of the signal, offering high temporal resolution for short-duration events (e.g., spikes in neural activity) and high frequency resolution for longer, sustained events.
- Discrete Wavelet Transform (DWT): Provides a compact representation of a signal using a set of wavelets. It is commonly used in feature extraction for applications like detecting event-related potentials (ERPs) in brain signals.
Wavelet transforms are ideal for applications requiring precise timing information, such as BCI systems that rely on rapid brain signal classification for real-time control.
4. Spatial Features
In neuroimaging modalities like fMRI or MEG, the spatial distribution of neural activity is a critical feature. Spatial feature extraction methods aim to identify regions of interest (ROIs) in the brain that are associated with specific tasks or mental states.
- Region-of-Interest (ROI) Analysis: In fMRI, brain activity is measured by the blood oxygenation level-dependent (BOLD) response. ROI analysis identifies specific brain areas (e.g., the prefrontal cortex) where changes in neural activity correlate with cognitive tasks or stimuli.
- Connectivity Patterns: Neural data often capture relationships between different brain regions. Features like functional connectivity (the correlation between time series of activity in different regions) and structural connectivity (the physical connections between brain areas) provide insights into how different parts of the brain interact during specific cognitive processes.
Spatial features are key to understanding large-scale brain networks and are frequently used in cognitive neuroscience research to decode mental states from neuroimaging data.
5. Principal Component Analysis (PCA)
PCA is a dimensionality reduction technique used to condense high-dimensional brain signal data into a smaller number of uncorrelated components that retain the most significant variance in the data. PCA is particularly useful in reducing noise and simplifying the input data for machine learning models, making it easier to identify key neural patterns.
For example, in EEG-based neuroprosthetic applications, PCA can be used to reduce the number of features (e.g., signal channels) while preserving the essential brain signal information needed for controlling prosthetic limbs.
6. Higher-Order Statistical Features
Neural data often exhibits non-linear and complex relationships, which cannot always be captured through basic signal properties like mean or variance. Higher-order statistical features provide additional insights into these complex dynamics.
- Skewness and Kurtosis: Skewness measures the asymmetry of the signal distribution, while kurtosis measures the "tailedness" of the distribution. These features help capture non-linear patterns in brain data.
- Entropy: Entropy measures the complexity or unpredictability of a signal. Higher entropy indicates more randomness in the neural activity, while lower entropy suggests more structured or repetitive patterns, which can be used to differentiate between mental states.
7. Event-Related Potentials (ERP)
ERPs are specific patterns in brain activity that occur in response to a stimulus or event. Extracting ERP features involves identifying the characteristic waveform components (e.g., P300, N400) that are associated with cognitive processes such as attention, memory, or decision-making.
ERP-based features are widely used in BCIs, where users may control devices by focusing on specific stimuli, producing detectable ERP responses.
Importance of Feature Extraction in Neurotechnology
In neurotechnology, the success of machine learning models largely depends on the quality of the extracted features. Effective feature extraction can:
- Reduce Computational Complexity: Neural data is often high-dimensional, and feature extraction reduces the data size, making it more manageable for machine learning algorithms.
- Enhance Model Accuracy: Extracting the most informative features ensures that the model focuses on the relevant aspects of the brain signals, improving predictive accuracy.
- Improve Interpretability: By transforming raw neural data into meaningful features, researchers and clinicians can gain deeper insights into brain function and identify biomarkers for conditions like epilepsy, Alzheimer's disease, and depression.
Feature extraction is the bridge between raw neural data and actionable insights, making it one of the most critical steps in applying machine learning to neurotechnology. Whether through time-domain analysis, frequency-domain analysis, or more advanced techniques like wavelets and PCA, feature extraction provides the foundation for building robust and effective neurotech applications.
Machine Learning Models Used in Neurotechnology
Support Vector Machine (SVM) Classifiers
Support Vector Machines (SVMs) are powerful supervised learning algorithms used in classification tasks. SVMs work by finding the optimal hyperplane that separates different classes of data points in a high-dimensional space.
Usage: In neurotechnology, SVM classifiers often categorize brain signals, such as identifying whether a person is experiencing a cognitive task or rest. They are particularly useful for binary and multiclass classification tasks, like differentiating between mental states or motor imagery (imagined movement).
Advantages: They perform well on high-dimensional datasets and are effective when data is linearly separable. They’re often used with kernel functions (e.g., RBF kernel) to capture non-linear relationships.
Drawbacks: SVMs can struggle with large datasets, and tuning the hyperparameters (e.g., regularization, kernel) can be challenging.
More Reading: SVMs Visual Explanation
Linear Discriminant Analysis (LDA)
Linear Discriminant Analysis (LDA) is another supervised learning technique commonly used in neurotechnology. LDA is a dimensionality reduction method that seeks to project high-dimensional data onto a lower-dimensional space while preserving class separability.
Usage: In applications like brain-computer interfaces, LDA is used to discriminate between different mental states by finding linear combinations of features that best separate the data classes (e.g., motor imagery vs. rest). LDA is also commonly applied in BCIs, especially in tasks like motor imagery classification, where brain activity patterns from EEG signals are classified (e.g., left-hand vs. right-hand motor imagery).
Advantages: LDA is computationally efficient, interpretable, and works well on small datasets, making it popular in real-time applications.
Drawbacks: LDA assumes Gaussian distribution of features, which may not hold true for complex EEG signals, potentially impacting performance.
K-Nearest Neighbors (KNN)
The K-Nearest Neighbors (KNN) algorithm is a simple yet effective method for classification and regression. KNN is based on the idea that similar data points should belong to similar classes. It classifies new data points by finding the majority class among its K-nearest neighbors in the feature space.
Usage: In neurotechnology, KNN can be applied to tasks like recognizing patterns in EEG signals for cognitive state detection or brainwave-based authentication. k-NN is used for real-time applications, such as emotion classification and state detection, based on EEG features.
Advantages: It’s simple to implement, intuitive, and works effectively on small datasets without extensive preprocessing.
Drawbacks: k-NN is sensitive to the curse of dimensionality, and it can be slow when deployed in real-time on large datasets, given the need to calculate distances for each prediction.
Random Forest
Random Forest is an ensemble learning method that constructs multiple decision trees during training and outputs the mode of their classifications or the mean prediction in regression tasks.
Usage: Random forests are often used for both classification and regression tasks within neurotech applications, especially when features extracted from EEG or other neural signals are numerous and may contain non-linear relationships. Random Forests have been applied to neuroimaging data for tasks like identifying brain regions associated with specific cognitive functions or predicting mental health outcomes based on brain connectivity patterns.
Advantages: They provide robustness to overfitting and handle high-dimensional data well. They also offer feature importance metrics, which can help in identifying key biomarkers.
Drawbacks: Random forests can be computationally intensive, and their interpretability decreases with a higher number of trees.
Convolutional Neural Networks (CNNs)
CNNs are deep learning models designed to recognize patterns in spatial data, often used for images but also effective for EEG spatial patterns. In neurotech, they are ideal for analyzing EEG channel data in BCIs, capturing spatial features across electrodes.
Usage: CNNs are increasingly popular for neuroimaging data, such as fMRI and EEG spatial-temporal features. They’re well-suited for extracting spatial patterns across electrodes.
Advantages: CNNs capture spatial dependencies, making them effective in BCIs for tasks like motor imagery, where patterns across channels are informative.
Drawbacks: They require large datasets and significant computational power for training, which may be a constraint in neurotech applications with limited data availability.
Recurrent Neural Networks (RNNs) and Long Short-Term Memory Networks (LSTMs)
RNNs and LSTMs process sequential data, capturing time-dependent patterns. They are essential in neurotech for applications like emotion detection and state prediction, where neural data changes over time and temporal patterns are critical.
Usage: RNNs and LSTMs are used for time-series EEG data in emotion recognition, attention monitoring, and state prediction applications, where capturing temporal dependencies is crucial.
Advantages: LSTMs can model long-term dependencies and are effective in tasks where EEG data is sequential, providing insights into evolving mental states.
Drawbacks: They can be computationally demanding and are prone to overfitting on small neurotech datasets.
Extreme Gradient Boosting (XGBoost) and LightGBM
These gradient boosting models build on decision trees to enhance accuracy through iterative training. They’re favored in neurotech for their high accuracy and ability to handle complex, non-linear data while identifying important features.
Usage: These boosting algorithms are commonly applied to extract high-quality features from EEG or fMRI data for classification tasks in neurotech, like distinguishing between different cognitive states.
Advantages: XGBoost and LightGBM provide high accuracy and are less prone to overfitting than simpler tree-based models. They also offer tools for feature importance ranking.
Drawbacks: They are less interpretable than linear models and may require extensive tuning.
Transfer Learning Models (e.g., Transformers)
Transfer learning models, including transformers, adapt pre-trained neural networks to new tasks. In neurotech, they allow models to generalize across users and datasets, making them promising for personalized BCIs and cross-subject analysis.
Usage: Although relatively new in neurotech, transformers and other transfer learning approaches are emerging for EEG classification, especially for generalized BCIs that aim to work across users.
Advantages: Transfer learning can leverage pre-trained networks and adapt to smaller datasets typical in neurotech, capturing complex patterns in neural data.
Drawbacks: These models are computationally expensive and require extensive pre-training, which can be a barrier in resource-limited neurotech setups.
Bayesian Models
Bayesian models offer a probabilistic approach, estimating uncertainty in predictions, which is helpful in neurotech for understanding the likelihood of different cognitive states. They’re commonly used in clinical applications and sequential data analysis.
Usage: Bayesian inference and Hidden Markov Models (HMMs) are used in EEG applications for uncertainty quantification and state estimation in sequential neural data.
Advantages: Bayesian models provide a probabilistic framework to handle uncertainty, which is beneficial in clinical neurotech applications.
Drawbacks: They require careful parameter tuning and can be computationally intensive, especially for real-time applications.
Additional Resources
- ML Models Quick Overview
- Choosing an Estimator
- Example Using Neural Networks
- MIT Lecture on ML Models
- ML Models Introduction
Past Projects
Neurotech@Davis, is a dynamic and innovative neurotechnology club dedicated to advancing the field of brain-computer interfaces (BCIs) and fostering the next generation of neurotech enthusiasts. At Neurotech@Davis, we are passionate about exploring the intersection of neuroscience and technology to create cutting-edge solutions that push the boundaries of what is possible. We design and develop state-of-the-art brain-computer interfaces that bridge the gap between the human brain and digital systems. Our projects range from wearable devices to sophisticated software that enhances communication, accessibility, and cognitive enhancement.
2022-2023 Projects Cohort
The 2022-2023 Neurotech@Davis’ first-ever cohort was a trailblazing team of 20 passionate innovators, guided by 3 dedicated co-heads, who came together to push the boundaries of brain-computer interfaces. In just one year, they brought five incredible projects to life—blending neuroscience, engineering, and creativity to make neurotechnology more accessible and impactful. This inaugural group laid the foundation for a future where technology and the human mind connect in exciting new ways.
Dino Game
Bringing Brain-Computer Interfaces to Everyone—A Fun and Accessible First Step into Neurotechnology.
Developed by Prakhar Sinha, Maitri Khanna, Raymond Doan, Avni Bafna, Brian Nguyen, Nhu Bui, Ankita Chatterjee
The Dino Game was one of the first fully functional BCI projects that was developed for UC Davis Neurofest 2023. The Dino Game BCI is an interactive brain-computer interface project that uses the Muse 2 headset to let users control the classic Chrome 'no-internet' game with just their eye blinks, making neurotechnology fun and accessible.
What it did
The Dino Game BCI was spawned out of the need to have a project to show off at the 2023 Davis Neurofest event. This was an event dedicated to showcasing UC Davis’s advancements in neurotechnology and Neuroscience. We needed to completely develop this project in less than 3 months.
After brainstorming, we came to the conclusion that making a BCI based on the famous Chrome “no-internet game” would be a crowd-pleaser and it would also be a project that wouldn’t be too difficult to develop. We chose the Dino Game, in particular, because it was a game that required very minimal inputs and therefore would be a good first project for us to develop in such a short amount of time.
The hardware we used was the Muse 2. Compared to the OpenBCI Cyton, the Muse 2 is a lot easier to set up and develop. Indeed, a big reason for making a lot of the decisions that we made on this project was due to time constraints. Following this logic, we opted to use the Muse 2 instead of the Muse for ease of development.
The Dino Game functioned as follows. On the “front-end”, the user was able to interact with a recreation of the Chrome “no-internet” game that we cloned off of GitHub. The way the user would interact with the game was by blinking their eyes in order to make the dino jump over obstacles. It was meant to be a simple, but powerful, demonstration of what BCI hardware, like the Muse 2, could accomplish.
Expanding the P300 Oddball Paradigm for a Versatile BCI System with Macro Command Input
Thought-Powered Coding—Exploring BCI for Seamless Vim Navigation.
Developed by Devia Dham, Aurielle Jocom, Mathangi Venkatakrishnan, Raymond Kang
Mentored by Prakhar Sinha, Maitri Khanna, Jordan Ogbu Felix
The P300 Macro Speller, developed for the 2023 Neurotech California Conference, aimed to revolutionize Vim navigation by detecting P300 brainwave responses, allowing users to switch modes and execute commands using thought alone—an ambitious project utilizing OpenBCI Cyton and Openvibe, with future potential for refinement.
What it did
The P300 macro speller was a project that was in development to present at the 2023 Neurotech California Conference. It posed this simple question: “what if, instead of having to manually switch modes in Vim, we could think about them to reduce development time?”. The development of this project was sadly met with a few problems but it was a very interesting idea we hope to explore further in later years.
This project is based on a well-established neurological phenomenon known as the P300 signal [could hyperlink to p300 article here]. This BCI would take advantage of these signals in order to detect when the user is thinking of a Vim command.
In their system, the stimuli are flashing lights presented on a screen, with the user focusing their attention on the desired stimulus to generate a P300 response. They expanded on this paradigm to allow for the selection of macros and commands, rather than just spelling out letters. This means that the user can input a range of commands, such as opening an application or initiating a specific action.
This project utilized the OpenBCI Cyton and Openvibe. Openvibe is meant to be an easy and accessible EEG recording and processing platform but it is also riddled with its own problems. The most prominent of these include many bugs while setting up and recording the EEG data. The most notable challenges faced by the group included having to wrestle with the Openvibe software to do what they wanted it to do.
Maximizing Learning Potential: An EEG-based Haptic Feedback BCI Solution for Improving Student Focus
Enhancing Focus with Brain-Computer Interfaces—Real-Time EEG-Based Study Assistance
Developed by Ayraman Bhatia, Grace Lim, Nhu Bui, Ramneek Chahil, Vraj Thakkar
Mentored by Prakhar Sinha, Maitri Khanna, Jordan Ogbu Felix
This BCI was entered into the 2023 NeurotechX competition where it won 3rd place. This BCI project utilizes EEG technology with OpenBCI Cyton, Brainflow, and Arduino to detect loss of focus in students by monitoring brainwave patterns and providing real-time haptic feedback to help maintain concentration.
What it does
This BCI was also a project that was in development to present at the 2023 Neurotech California Conference. Their BCI project utilized EEG technology to detect loss of focus in students during study and learning sessions. By monitoring the presence of common indicators of focus that consist of ratios of alpha, beta, and gamma waves, They were able to alert the user when their focus began to wane.
This BCI has utilized several different platforms/technologies: OpenBCI Cyton, Brainflow and Arduino. They were able to develop a simple yet effective solution to use haptic feedback so the user is alerted that their focus is wavering whether it may be towards the end of the session or during the session with a small vibration.
OpenBCI EEG hardware was used to collect samples of the brain waves which were used to detect focus. The placements of the electrodes consisted of the ground and reference electrodes, prefrontal cortex, frontal cortex, parietal cortex, and occipital cortex which helped aid in the detection of focus.
Controllerless Basketball Game using EEG-Based BCI: A Novel Approach for Virtual Reality Gaming
Mind Over Controllers—BCI-Powered Basketball for an Immersive Gaming Experience.
Developed by Adit Jain, Priyal Patel, Rytham D, Sasinathaya Aphichatphokhin, Tarun Devesetti
Mentored by Prakhar Sinha, Maitri Khanna, Jordan Ogbu Felix
This BCI project explored the intersection of gaming and neurotechnology by developing a controller-free basketball game, using EEG signals to detect jaw clenching for shooting mechanics—showcasing the potential of brain-computer interfaces in interactive entertainment.
What it does
This BCI started off incredibly ambitious but generally started to scale back as they realized what was and what was not possible given the skillset and development time that they did. Originally, the group had aimed to develop a Unity game in VR and using different neurological signals in order to perform different actions in the game. However, as deadlines inched closer and closer, we realized that we would need to cut some corners on our ambition in order for the project to be completed on time.
Their BCI project was centered around constructing a controller-less basketball game. The basic idea was for the user to shoot the ball by clenching their jaw and aligning the pointer with the basketball hoop. Utilizing EEG signals, the program was able to detect when a user clenches their jaw to trigger the shot in the game environment, while the duration of jaw-clenching controls the strength or distance of the shot. Later this was changed to just detecting jaw clenches in order to shoot the ball.
OpenBCI EEG hardware was used to collect samples of jaw clench data to identify the range of frequencies needed to train the model to detect the user's jaw clenching. The electrodes are placed above the motor cortex area of the brain, based on previous research that identified this area as being involved in jaw clenching.
Brainflow was used to parse the EEG signals and detect the desired stimuli in real-time. This BCI project offered an immersive and engaging gaming experience and was a really cool proof of concept to show what could be done with BCI’s. By using EEG signals to detect the user's jaw clenching, the game was able to respond in real time and it was a new and interesting look at the intersection between BCI’s and gaming.
Approach to Stress Detection and Alleviation using EEG-Based BCI with Targeted Music Therapy
Brain-Powered Stress Relief—Harnessing EEG for Real-Time Calm.
Developed by Anisha Patel, Avni Bafna, Brian Nguyen, Dat Mai, Heidi Sailor, Nabeha Barkatullah
Mentored by Prakhar Sinha, Maitri Khanna, Jordan Ogbu Felix
This BCI project leveraged EEG technology to detect stress by analyzing alpha and beta brainwave activity, providing real-time calming responses through tailored 18.5 Hz music therapy—offering an innovative solution to stress management in everyday life.
What it does
The main idea of this BCI was to improve the lives of individuals experiencing stress by providing appropriate responses to alleviate its negative effects. Through the utilization of cutting-edge technology, the project was able to detect stress by analyzing the size of alpha and beta activities in the frontal hemisphere and monitoring brain activity in the right frontal hemisphere. Once stress is detected, the BCI is designed to provide calming responses to the user. The team has identified the optimal frequency for focus and concentration to be 18.5 Hz, and we have utilized this frequency to create a calming music response to reduce stress levels.
The project's innovative approach to detecting and alleviating stress provided a unique solution to a common problem. By utilizing EEG signals to detect stress levels and providing real-time appropriate responses, the BCI project aimed to improve the quality of life for individuals who experience stress on a daily basis. The combination of technology and research used in this project provided an effective and efficient method to alleviate stress, which had the potential to be widely applicable in various settings such as educational institutions, workplaces, and healthcare facilities.
2023-2024 Projects Cohort
The 2023-2024 Neurotech@Davis cohort was a powerhouse of innovation, growing to 56 passionate members across 9 teams, led by 5 dedicated co-heads. With a shared vision of pushing the boundaries of neurotechnology, this cohort tackled ambitious projects that explored the limitless potential of brain-computer interfaces. Their collective creativity, collaboration, and drive solidified Neurotech@Davis as a thriving hub for cutting-edge research and development in the field.
Robotic Arm Movements BCI Controlled By EEG Mental Commands
Thought into Motion—Harnessing EEG to Control Robotic Limbs.
Data Collection: Abrianna Johnson, Avni Bafna, Grace Lim
Software and Hardware: Adit Jain, Ahmed Seyam, Evan Silvey, Prakhar Sinha, Priyal Patel
This BCI project uses EEG signals to decode mental commands—such as “grab,” “drop,” “left,” and “right”—and converts them into real-time physical movements of a robotic arm. Leveraging mental imagery primed by video stimuli and personalized training sessions, the system enables direct control of robotic hardware through thought alone.
What it does
This brain-computer interface enables users to control a robotic arm using non-invasive EEG technology. The system is designed to interpret distinct mental commands based on motor imagery and emotional arousal, translating them into specific actions of a robotic hand.
To achieve this, the team developed four core commands:
- Grab: Triggered by imagining a slow, deliberate phone lift.
- Left: Stimulated by envisioning a water bottle moving leftward.
- Right: Evoked using a fast, high-arousal stabbing motion with a pen.
- Drop: Prompted by visualizing a cartoon piano dropping from above.
Each mental command was paired with a priming video to elicit the intended neural response. During training, subjects reviewed these stimuli, spent a few seconds forming the associated mental image, and then entered a focused recording phase. They could accept or reject each session depending on their confidence in task execution. A “neutral” state served as the baseline, where subjects consciously refrained from mental imagery. Commands were introduced incrementally, allowing users to train each command independently and build familiarity before progressing.
How it works
The system relies on rhythmic EEG patterns and motor-related mental imagery, likely utilizing mirror neuron activation. A subject-specific baseline was created using the neutral state. All EEG data were collected from consistent electrode channels on the EMOTIV Insight headset. The trained commands were individualized to each subject’s neural patterns and mapped to robotic movements.
Results / Conclusion
Mental commands were detected in real-time using Emotiv’s software integrated with the Node-Red toolbox. A thresholding mechanism (initially ranging from 70–90) helped filter noise and validate signal strength, with each command producing a specific integer output:
- 1: Grab
- 2: Drop
- 3: Left
- 4: Right
These values were relayed via serial connection to an Elegoo UNO R3 microcontroller programmed through the Arduino IDE. The microcontroller activated specific servo motors controlling a 3D-printed robotic hand. Using a pulley system with fishing line, the servo motors applied tension to mimic finger and wrist movements in response to the user’s thoughts.
This project demonstrates a novel approach to assistive technology, showcasing the feasibility of thought-controlled robotics using affordable EEG hardware and customized training workflows.
NeuroBird: Using Steady-State Visually Evoked Potentials to Guide a Drone
Brainwaves Take Flight—Controlling Drones with the Power of Sight.
Developed by Alex Czerminski, Angelina Gyves, Sofia Fischel, Anthony Noshy, Priyanshi Singh, Shreya Vallala
Mentored by Avni Bafna, Adit Jain, Prakhar Sinha
This BCI project explored the use of Steady-State Visually Evoked Potentials (SSVEPs) to guide a drone through user intent. By leveraging EEG technology and live visual stimuli at two flashing frequencies, the drone was directed left or right through an obstacle course, making neuro-powered flight a reality.
What it does
The NeuroBird leverages distinct SSVEP responses elicited by two separate flashing frequencies to direct a drone in real-time. Participants view a live video feed from the drone on a tablet while facing two screens that flash at 5 Hz (left) and 7.5 Hz (right). Based on the frequency that matches the participant's visual focus, the drone receives directional input to move left or right accordingly.
The system was designed to make navigation intuitive—simply by focusing on one screen or the other, the user influences the drone’s direction, creating a seamless interaction between brain activity and aerial robotics.
How we built it
Participants sat in front of two monitors showing flickering lights at fixed frequencies. Electrodes were placed at O1 and O2—locations responsible for processing visual stimuli. Additional electrodes were placed on the frontal lobe and ear lobes to provide reference and control data.
Three key trials were conducted:
- Trial A: Establish baseline SSVEP responses between left (5 Hz) and right (7.5 Hz) stimuli.
- Trial B: Repeat with participants occasionally glancing up at the live drone feed on a tablet.
- Trial C: Assess noise introduced by the video stream’s own flicker effect to determine interference.
Each of the four participants completed five iterations of each trial, helping identify trends in SSVEP response behavior under varying conditions.
Background
The brain's visual cortex responds to flickering visual stimuli with steady electrical patterns known as Steady-State Visually Evoked Potentials (SSVEPs). These responses are stable and occur at the same frequency as the visual input, making them ideal for non-invasive BCI applications.
SSVEPs are a subset of event-related potentials (ERPs), where repeated visual stimulation leads to predictable, periodic brain responses. Detecting these patterns via EEG allows us to interpret user intent purely through eye gaze and focus.
Results & Conclusion
Despite preprocessing, the initial trials did not consistently yield clear SSVEP peaks. One instance of Trial B showed a potential spike at 5 Hz, but reproducibility remained a challenge.
We suspected inaccuracies in frequency mapping due to temporal drift in our CytonBoard, prompting a refinement of our data collection protocol. The updated trials involved direct exposure to each frequency (5 Hz and 7.5 Hz) for 30 seconds without interference.
Next steps involve integrating a K-Nearest Neighbors (KNN) classifier to categorize EEG data into left, right, or forward commands. These classifications will be translated into real-time drone commands using the Tello Drone’s API, enabling autonomous, brain-driven drone navigation.
This project showcases the potential of EEG-based BCI systems in real-world applications and paves the way for future innovations in hands-free, vision-driven technology.
P300 ERP Signal Excitation and Analysis
Using EEG and stimulus-driven experimentation to detect P300 brainwaves and explore their application in brain-computer interfaces.
Authors: Emma Chan, Alan Lin, Siri Manthapuri, Taner Karaaslan
Mentored by Avni Bafna, Adit Jain, Prakhar Sinha
Abstract
The OpenBCI Cyton board was used to extract EEG signals for data collection. In each data collection trial, the test subject observed a colored LED that was set to white by default. Over a period up to 202.41 seconds, the LED's color would be changed at random times and then instantly reverted to the default color. This color change served as the target stimulus meant to trigger the P300. Each time a color change happened, a timestamp was marked. We conducted 5 data collection trials with 87 instances of P300 in total with two subjects.
Our data was then preprocessed and visualized using MNE-Python. During preprocessing, several filters were applied to the data: a bandpass filter with a band of 0.5-35 Hz and a 60 Hz notch filter. The bandpass filter served to increase the P300’s visibility in frequency-domain graphs. The notch filter served to filter out power line noise. Independent component analysis was then utilized to remove possible artifacts in the EEG data.
The P300 is an event related potential (ERP) that occurs approximately 300 ms after the presentation of sudden, unexpected stimuli. Our project aims to explore the P300’s human-computer interfacing capabilities by developing a P300-based Connect-4 brain-computer interface (BCI). To develop this BCI, several EEG data collection trials were conducted in which a test subject was presented with unexpected stimuli. From the collected data, the P300’s frequency was determined to be approximately 32 Hz. Peaks in the EEG data were observed approximately 300 ms after each presentation of unexpected stimuli thus verifying the P300’s presence. Our findings provide a body of data that can be used to develop a P300 classifier and a P300-based Connect-4 game.
Introduction
The P300 relies on the oddball paradigm in which participants are presented with a common stimulus and then presented with a rare/target stimulus. The presentation of the rare stimulus is what triggers the P300. Research on P300 in BCIs has focused on leveraging this response to rare stimulus to enable user control, offering a direct pathway for communication and control through the interpretation of the brain's responses to specific stimuli. Our team aimed to utilize previous research on P300 and BCI user control to create a P300-based BCI that demonstrates the P300’s user control capabilities.
In our Connect-4 BCI design, participants focus on which column they would like to drop their piece into. Each column will flash and change into a different color. Once the participant’s column of focus changes color, the P300 is triggered, as the color change is the rare stimulus, which then alerts the computer to place a disk in the column of focus, essentially allowing for the game to be played only with the mind.
Methods
-
Data Collection:
- Hardware: OpenBCI Cyton board for EEG signal collection
- Stimulus: Colored LED that changes color to trigger P300
- Data Collection Trials: 5 trials, 87 P300 instances, 2 subjects
-
Preprocessing:
- Bandpass filter (0.5–35 Hz) to enhance frequency resolution
- 60 Hz notch filter to remove power line noise
- Independent Component Analysis (ICA) for artifact removal
- Visualization and preprocessing were performed using MNE-Python
Results
Once we finished preprocessing the data and cleaning it up to prepare for feature extraction and classifier training, we generated graphs of the preprocessed data in time-domain and frequency-domain. A spike can be observed at around 32 Hz, which indicates the P300’s frequency. A positive inflection can be observed at around 66.3s (one of the times the target stimulus was shown), thus indicating the presence of the P300. This data will be used later in classification and training the classifier.
Conclusion
So far, we have been able to stimulate the P300 ERP using a light and collect the data via EEG sensors using the OpenBCI Cyton Board. We were then able to preprocess this data and epoch the data based on the timestamps indicating the occurrence of uncommon stimuli. Our future steps include developing a support vector machine classifier using the collected P300 data. Once the classifier has been trained, we will then develop a Connect-4 game. In this, we will be changing the colors of the columns through flashes of light, similar to the stimulus used during our data collection, to invoke the P300 ERP. Our classifier should then recognize this response and prompt the computer to put the disc in the player’s desired column, completing their move. We hope to accomplish this with the goal of ultimately having a setup where participants can play a simple game from their childhood with only their thoughts.
BrainBeats – An EEG-Based Music BCI for Enhanced Focus
Personalized Study Soundtracks—Decoding Focus with EEG and Machine Learning.
Developed by Dara Banaie, Nidhi Vadulas, Britney Nguyen, Gautham Sivakumar, Devansh Vora
Mentored by Prakhar Sinha, Avni Bafna, Adit Jain, Dhruv Sangamwar, Aryaman Bhatia
Introduction
College students are constantly found with earbuds or wireless headphones as they do everything from walk to class to study for a final exam. Due to this extensive influence on students’ lives, we decided to see if various music genres can influence academic performance. There are contrasting views on whether music is beneficial for students. On one hand, some claim that music can improve the longevity of memory, enhance comprehension, and reduce anxiety. Studies have shown that distinct patterns of neural activity are associated with attentional states, with music facilitating those states. However, listening to music while trying to learn is also deemed as distracting and counterproductive. It is important to ask whether that applies to all genres of music and to all students equally. We believed that this question was worth exploring to discover and develop good study habits for ourselves as well as our peers.
Objectives
- Understand which genre(s) of music, if any, promote focus and help concentration.
- Study the converse—see which genres of music, if any, might negatively impact focus.
- Inform participants on which genre of music is the most beneficial for their academic performance.
- Help students make informed decisions on which genres of music to listen to while completing focus-related tasks and which to avoid.
- Develop personalized playlists that help users stay focused by analyzing their performance and making genre suggestions in real-time.
Experimental Methods
Our selected music genres included classical, jazz, ambient, and lofi. Each genre was played for 10 minutes per participant, totaling 40 minutes of data collection per person.
There were 7 participants in total. Each participant worked on homework or studied while listening to music and had their data collected.
Data was collected using the OpenBCI Focus Widget, which recorded time spent concentrating based on EEG signals.
How the Model Works
Our project utilizes EEG data collected from participants to classify their focus states while listening to different music genres. Generating alpha and beta waves, we calculated a focus value from the EEG readings. We employed a Support Vector Machine (SVM) classifier to process EEG data and focus values.
The model discerns whether participants are in a focused or unfocused state based on features extracted from EEG recordings, specifically Alpha and Beta wave power.
Type of Model
We used a Support Vector Machine (SVM) classifier for our task. SVMs are highly effective for high-dimensional data and for finding an optimal hyperplane that separates two classes—in our case, focused vs. unfocused.
Parameters
Key parameters include:
- C (Regularization Parameter): Balances the trade-off between maximizing the margin and minimizing classification error.
- Kernel Function: Determines the flexibility of the decision boundary. Options considered included linear, polynomial, and radial basis function (RBF) kernels.
Inputs and Outputs
- Inputs: Features extracted from EEG data (specifically Alpha and Beta wave power from FFT amplitudes).
- Output: Binary classification indicating focused or unfocused state.
Prediction of Overall Focus per Genre
Following classification of focus states, we aggregated the predictions to determine overall focus by genre for each participant. By analyzing these distributions, we identified the music genre that best facilitated focus for each individual. This insight helps recommend personalized music playlists tailored to enhance concentration and productivity.
Results and Analysis
Our data showed that lofi was the most successful at eliciting concentration among participants, while jazz was the least. While lofi was consistently helpful for most participants, others responded better to ambient or classical music. These differences suggest that music preferences and effectiveness are highly individual.
Several confounding factors may have influenced our results. Participants chose their own tasks, which might have varied in difficulty or familiarity. Prior experience listening to music while studying could also have affected how they processed music as a stimulus.
Summary & Future Directions
Our study highlighted the potential of EEG-based BCI systems to guide students toward personalized music choices that enhance focus.
Future steps include:
- Expanding the dataset with more participants.
- Incorporating additional music genres (e.g., pop, frequency tones).
- Developing real-time applications that interpret EEG data and recommend music dynamically.
- Exploring EEG-based detection of other cognitive states like relaxation or motivation.
By combining neuroscience and machine learning, BrainBeats offers a unique approach to improve academic performance through brain-driven music personalization.
2024-2025 Projects Cohort
The 2024-2025 Neurotech@Davis cohort marks another year of groundbreaking innovation, growing to 65 members across 8 dynamic teams, guided by 5 dedicated co-heads. With a passion for bridging neuroscience and technology, this cohort is pushing the boundaries of brain-computer interfaces, developing cutting-edge projects that redefine what’s possible. Their dedication and collaboration continue to shape the future of neurotechnology at Davis and beyond.
Lectures and Workshops
Some lectures may not have recording, those that don't will not have a link.
Lectures
Lecture 1 - Intro to Neurotechnology & BCIs | Recording
Lecture 2 - Intro to Neuroscience & EEGs | Recording
Lecture 3 - The BCI Pipeline | No Recording
Lecture 4 - Intro to Machine Learning | No Recording
Lecture 5 - EEG Signal Preprocessing | Recording
Lecture 6 - EEG Signal Processing | Recording
Workshops
Workshop 1 - OpenBCI & MUSE Demo
Workshop 2 - EEG Signal Analysis Workshop
This page will contain links to more learning resources on EEG, openBCI, etc.
Websites
The BCI Guys - Great resource!
NeuroTechX Edu - Great resource!
Neurotech@Davis Youtube Channel!
Intro to Neurotechnology - Berkeley course
Beginner’s Guide to Brain Computer Interfaces
Textbooks
Applied Event-Related Potential Data Analysis
Computational Cognitive Neuroscience, 4th Edition